by Dan Haug | Nov 20, 2022
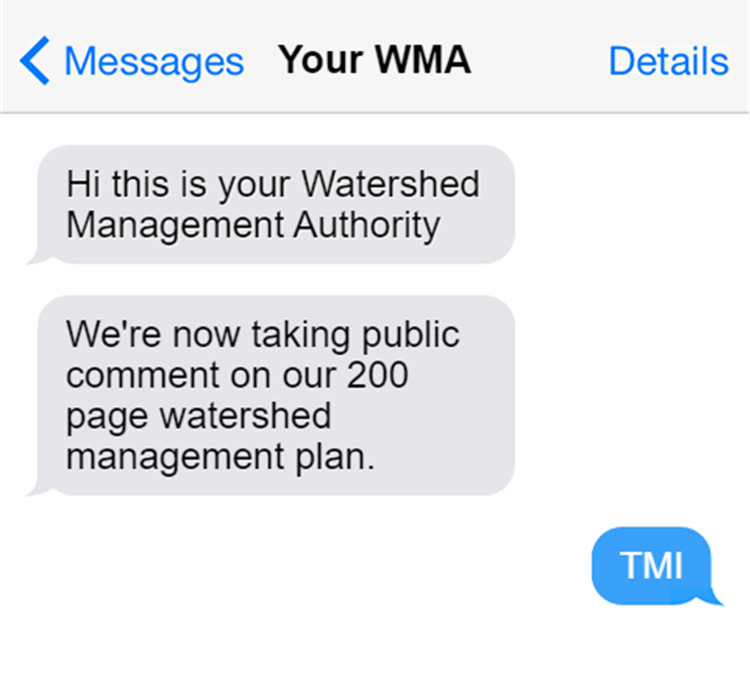
I missed the deadline for public comment on the new watershed plan for the Headwaters of the South Skunk River. We were given only two weeks and it’s a 200-page document. I can either respond with a quick text message: “TMI” (Too Much Information) or with a careful read and 700-word article. Since the deadline is passed, these comments are really meant for our readers who might be wondering what’s in the plan and what it will mean for the river.
Watershed Management Authorities (WMAs) are authorities in name only, with no taxing or regulatory authority, and given no direct funding from the state. Quarterly WMA meetings are a good forum for sharing news about water-related projects and opportunities, but some WMAs go years without managing a budget or holding a vote. Skimming the plan gives me hope that the Headwaters of the South Skunk River WMA could be more productive.
One of the most illuminating parts of the plan is this piece, which explains the role of a Watershed Management Authority, its member jurisdictions, and some of its partners. Chapter 7 fleshes out what needs to be done and who’s responsible. Chapter 8 fleshes out where they could get the money to do it. Put together, it’s a road map for getting some conservation practices on the ground, and cleaning up the water.
The report includes a lot of good technical information about pollution and solutions. I especially like Chapter 5, with its emphasis on practices that can address both nutrient reduction and other issues like habitat and flooding. There are some new ACPF maps for Hamilton County that will be very helpful for working with farmers to find suitable places for bioreactors, wetlands, and other structural practices. There’s an eye-opening section on absentee-owned farmland (section 2.03) and why it might not be as big a barrier to conservation as people think it is.
But like most watershed plans, the emphasis is on all the tasks that were completed and all the information that was compiled, rather than what was learned and why it’s important. This style of technical writing has two negative consequences:
First, it makes it hard for a casual reader to tell the difference between what we know and what we don’t know. Here’s a table that looks like a list of invasive species in the watershed, but is actually a list of invasive species in the state, that may or may not be found in this river system. Then there’s a table of streams with designated uses, but it doesn’t actually tell us which ones can support fishing or swimming. Most of the smaller streams are only presumed to be swimmable, and if the DNR gets around to checking (through a field study called a Use Attainability Assessment), the rebuttable presumption would likely be rebutted. I have spent many hours dealing with the confusion resulting from this little caveat: see Chapter 2 of the Story County Water Monitoring Plan.
Skimming through page after page of maps and tables gives the impression that the watershed has been exhaustively researched, but some of the main recommendations of the plan are for additional assessments that wouldn’t fit in the budget.
- We know that normal farming practices can leak nitrogen and phosphorus, but we don’t know which areas are leakier than average, to be able to prioritize conservation practices where they can do the most good. The plan recommends additional monitoring in Hamilton County and the construction of a computer model.
- We don’t know much about flood risks and mitigation opportunities in the watershed. The plan recommends commissioning a hydrologic assessment.
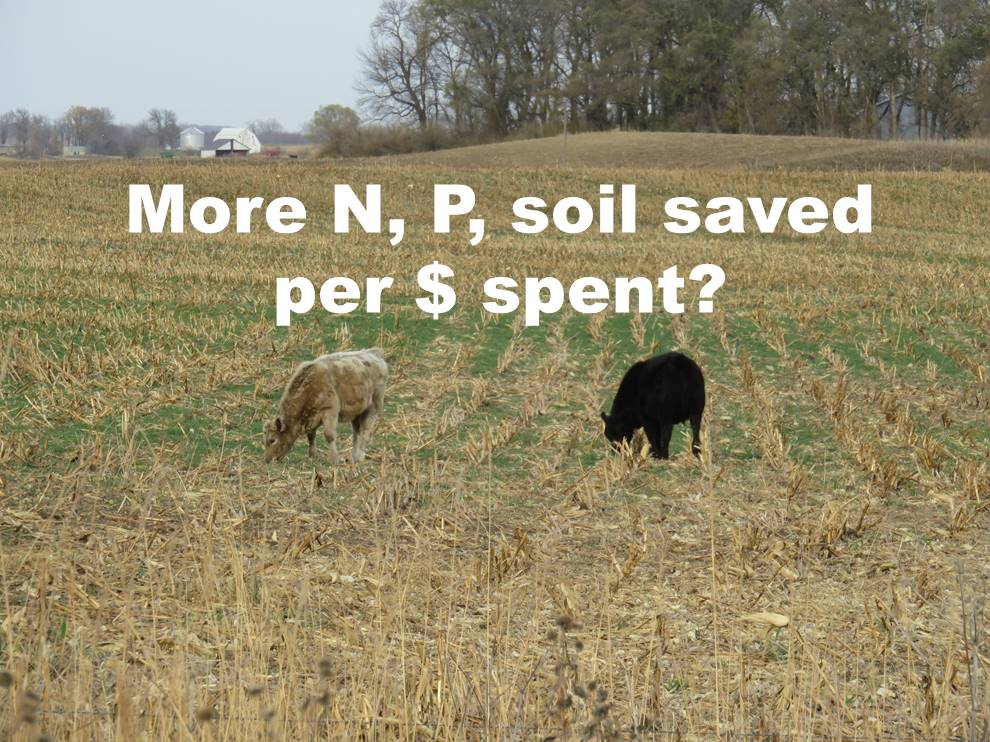
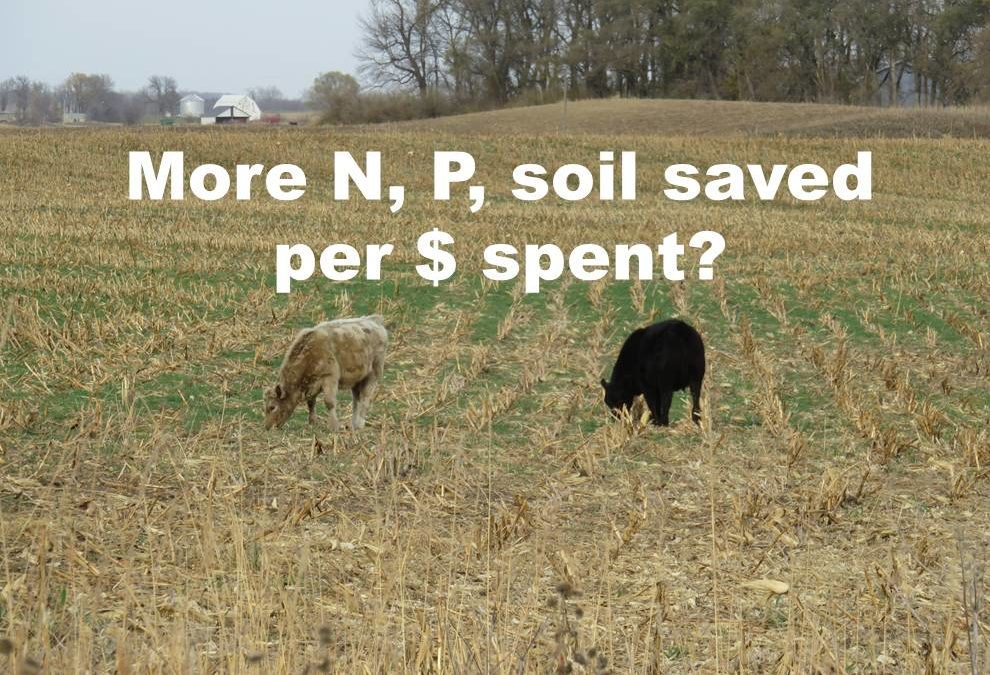
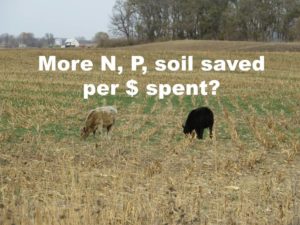
Second, it reinforces a very human tendency to see what we expect to see. If you expect to see high nitrogen levels in the South Skunk River, you have to look very carefully at the graph to realize that no, nitrate was actually quite low the last two years (a median of 3.1 mg/L) because of the drought. I didn’t notice it until my third look at the poster above. If the report is full of maps and tables that don’t seem important, or that tell you things you already know* then you stop looking carefully. And that’s how you end up setting a target that would require an 80% reduction in nitrate, relative to the long-term average (8.8 mg/L). Fortunately, I caught this during the public comment period, and authors are fixing it for the final draft. I mention this not to criticize anyone, but to illustrate why it’s important (and not easy) to connect the dots between data, their implications, and action.
* A lot of the inventory chapter reads like “Figure 1 – Central Iowa is flat, Figure 2 – Central Iowa has a lot of corn and soybean fields, Figure 3 – The fields have drainage tiles, Figure 4 – Central Iowa raises a lot of hogs.”
I hope that Prairie Rivers of Iowa can work with the new Watershed Management Authority to help connect those dots, and help to implement the recommendations in what I think is a solid plan.
by Dan Haug | Jun 4, 2020
On any field in Iowa, cover crops will improve soil health, sequester carbon, and prevent nutrients from washing down to the Gulf of Mexico. There are at least six situations where cover crops can add to the farmer’s bottom line, but in other situations, or to help encourage farmers to make that initial investment and get through the troubleshooting stage that comes with any new practice, public cost sharing can make a difference. Most taxpayers I talk to are quite willing to pay farmers who are employing conservation practices for the ecosystem services they provide. But we either can’t afford to or aren’t willing to invest at the scale needed to achieve universal adoption of cover crops and other conservation practices, and that means we have to make some decision about where to invest first, so as to get the most nutrient reduction (and hopefully carbon sequestration, soil protection, flood reduction, and other benefits) for our buck.
Most of those discussions are way above my pay grade. I suppose the legislators who draft the federal farm bill and the NRCS bureaucracy set payment rates and application scoring criteria for EQIP and other cost share programs. Iowa’s Water Resource Coordinating Council picked priority watersheds that can get special funding.
Planning at the local level can also influence where conservation investments are made. However, it’s not always clear what influence a Watershed Management Authority actually has over where 1000 acres of cover crops gets planted, or why it’s better to plant them in one part of a county rather than another. Same goes for other conservation practices. Here are 5 possibilities.
1. Plant cover crops where they can protect a local lake or water supply
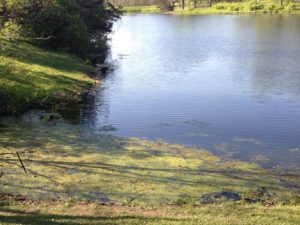
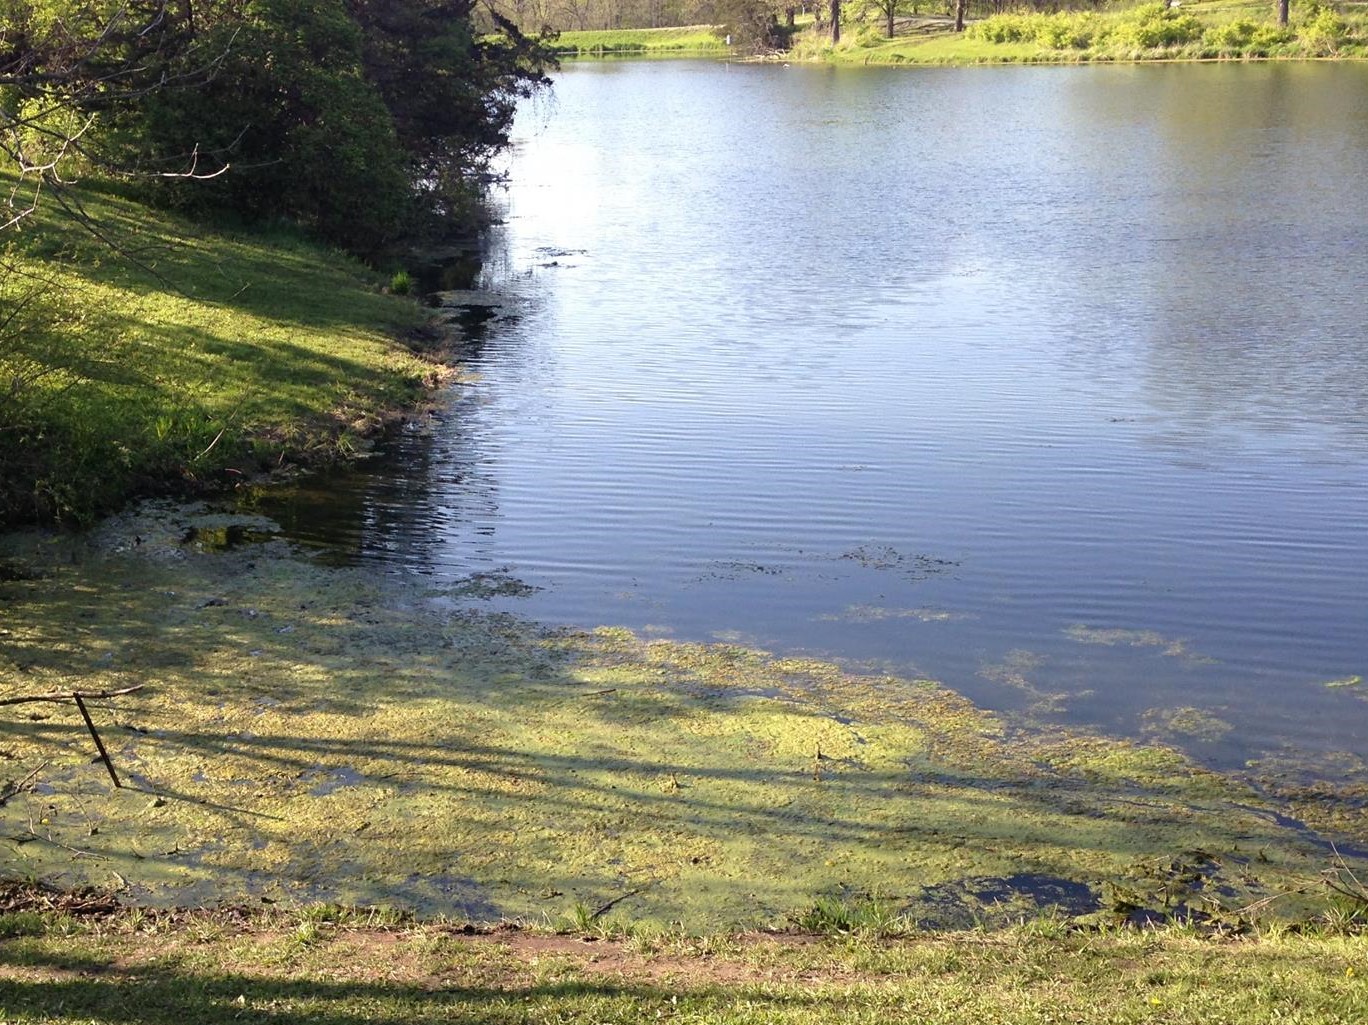
In addition to Gulf Hypoxia, phosphorus that washes off the land is causing algae blooms in many of Iowa’s lakes. Overnight, these algae blooms can use up the oxygen that fish and other aquatic critters need to breathe. Some kinds of cyanobacteria can produce toxins that can harm people and pets. Algae blooms are nuisance for those who would like to swim, fish, boat, or water-ski in those waters. We can address two problems at once if those 1000 acres of cover crops are planted in the watershed of Hickory Grove Lake, Saylorville Lake or other water bodies suffering from an excess of green.
In addition to Gulf Hypoxia, nitrogen that washes off Iowa farmland can cause a problem for cities that pull their water from a river, or from wells close to and influenced by a river. The Des Moines Waterworks and the Raccoon River watershed have rightly gotten a lot of attention, but other cities in other watersheds (like Boone, on the Des Moines River) also are dealing with high nitrate in their source water. Cover crops in the right watersheds can help protect those water supplies.
Nitrogen and phosphorus can also cause algae blooms in creeks and rivers, but the science is more complicated than in lakes, and not often done. For example, while the Squaw Creek Watershed Management Plan demonstrates that nitrogen and phosphorus levels in the creek are high, it does not make the case that meeting our nutrient reduction goals will protect drinking water, improve fisheries, make for safer recreation in Squaw Creek. Maybe that’s a safe assumption, but I honestly don’t know.
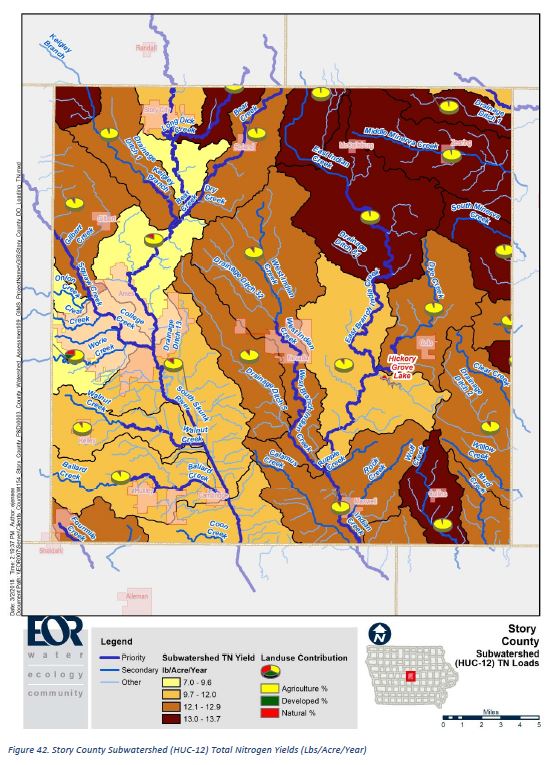
2. Plant cover crops where they can reduce the most nitrogen
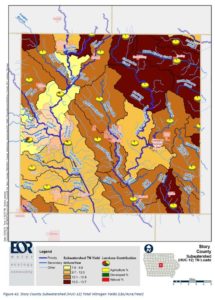
Here’s a map of nitrogen load by HUC-12 watershed in Story County, based on landcover. This kind of model would be handy if you wanted to guess which stream has higher nitrate levels at its outlet. If I plant 1000 acres of cover crops south of McCallsburg (in the “Drainage Ditch 81” hydrologic unit) will I get more nitrogen reduction than if I plant them west of Ames (in the Squaw Creek-Worrell Creek hydrologic unit)? Nope. The pounds/acre estimate here is for the whole watershed, and it’s based purely on landcover in that watershed. Unlike the larger watershed, a field west of Ames wouldn’t be 20% developed, it’d be 100% agriculture, so with this model we can’t assume it’d be different than a field anywhere else in the county. More sophisticated computer models like SWAT or SPARROW incorporate things like soils, slope, and county-level fertilizer sales as well as landcover, but it’s hard to tell which of those things is driving the results.
Other models like the Nutrient Tracking Tool are field scale, and can be used for this kind of prioritization. Running through some quick scenarios, I estimated that cover crops on a tile-drained field in the Squaw Creek watershed could prevent 9 lbs/acre of nitrogen loss each year, versus 3 lbs/acre in an undrained field in the watershed. Computer models can be helpful, if we’re clear about their purpose and limitations.
3. Plant cover crops where they can reduce the most phosphorus and sediment
Cover crops have gotten more traction in hilly southern Iowa, where soil erosion is a more visible problem and no-till is common. From a standpoint of tons of soil erosion prevented, or pounds of phosphorus loss avoided, it makes sense to plant on fields with steep slopes and erodible soils. Models like RUSLE can be helpful for this.
4. Plant cover crops where their water quality benefits can best be measured
1000 acres of cover crops will make a bigger splash in a small watershed than in a big one. A small change in water quality is difficult to detect. Just like a poll that talks to a small number of people has a margin of error, a water testing program that samples only 12 or 24 days out of the year will have some uncertainty attached to the results. I’ll be talking more about “minimum detectable change” in future posts, but suffice to say that margin of error is usually closer to 10 or 20 percent than 1 or 2 percent. That means we need to give some thought to where conservation practices will be located relative to long-term water monitoring sites if we hope to document their effects with water monitoring.
| Location of monitoring sites in Story County, and agency monitoring | Row-cropped acres in watershed | Expected N and P reduction at monitoring station from 1000 acres of cover crops in watershed |
| CREP wetland inflow (Conservation Learning Labs) | 1,270 | 23.62 % |
| Walnut Creek @ 530th Ave, near Kelly (USDA) | 3,756 | 7.99% |
| Onion Creek @ Reactor Woods, Ames (ISU) | 10,104 | 2.96% |
| E. Indian Creek @ S27 (SCC/PRI/Ames) | 63,852 | 0.47% |
| Squaw Creek @ Moore Park (IIHR) | 99,919 | 0.30 % |
| Squaw Creek @ Lincoln Way (SCC/PRI/Ames) | 107,775 | 0.27% |
| South Skunk River @ Riverside Drive (DNR) | 162,718 | 0.18% |
| South Skunk River @ 280th St, Story County (DNR) | 297,547 | 0.10% |
5. Plant cover crops where it is most cost-effective for the producer
We do some of this unintentionally. A farmer who can figure out how cover crops will make financial sense for their operation–cutting a pass for weed control or loosening compaction, providing forage for cattle, or protecting yields in wet or dry years–is more likely to sign up when the cost share being offered is $25-$35/acre. Those that think they will lose money will pass until we offer better incentives–for example, Maryland was paying up to $90/acre and has gotten more takers.
This is also the idea behind “precision conservation” promoted by Land O’Lakes and other retailers. With precision yield monitoring, conservation practices like wetlands, prairie strips, or buffers can be placed so as to minimize lost revenue. Poorly draining or steep parts of a field might actually cost more to plant, till, and fertilize than it generates in revenue, so farmers could install conservation practices and even come out ahead.
That’s 5 ways to get more conservation bang for our buck. Let’s be more clear about which of these we’re hoping to achieve when we do watershed planning, and more creative about how we support good stewardship.
Does this make sense? Are there other ways to be more cost-effective with conservation? Leave a comment!
by Dan Haug | Feb 13, 2019
An update on our watershed planning efforts is long overdue. Our NRCS Conservation Innovation Grant for the “Keigley” watershed project wrapped up in September of 2018. Here’s some of the highlights from 2017-2018 and what we’ll be doing next.
A change in focus: No more need to explain that by “Keigley Branch Watershed” we really mean “part of the South Skunk River.” In the future, we’ll be working with the entire 200,556-acre watershed that drains to the South Skunk River above the confluence with Squaw Creek in Ames. On paper, a single ten-digit hydrologic unit (HUC10) seemed like a more manageable project, but as we talked with the public it became clear that watershed plans and partnerships would be more effective if the river’s headwaters in Hamilton County were included sooner rather than later.

Headwaters of the South Skunk River watershed
A new Watershed Management Authority (WMA): The Headwaters of the South Skunk River WMA was formed in August 2018 with seven signatories:
- Story County Supervisors
- Story County Soil & Water Conservation District
- Hamilton County Soil & Water Conservation District
- City of Ames
- City of Story City
- City of Roland
- City of Randall
We hope more jurisdictions will join as the partnership takes shape. Good communication between the cities, counties, and conservation districts in a watershed leads to more and better projects that improve water quality and soil health.
Great public input: 80 people—56 residents, 15 high school students, and 9 ISU students—attended our public workshops. The goals and implementation strategies they suggested will provide a great starting point for the WMA to develop an actionable plan for conservation in the Headwaters of the South Skunk River watershed.

An interactive map of conservation opportunities: Between this project and Story County’s assessment of its watersheds, we have identified suitable spots for bioreactors, grassed waterways, constructed wetlands and other agricultural conservation practices across 728,144 acres! Check out our interactive map to get ideas for conservation practices that might work on your farm or in your watershed, along with an explanation of each practice.
Winter is a busy season for grant-writing. We are currently looking for funding to provide education and technical assistance to farmers and landowners in this watershed, to build partnerships with more groups in Hamilton County, to fill in missing information identified during the planning process, and to support the new WMA in completing a plan for the Headwaters of the South Skunk River watershed. This is just the beginning!