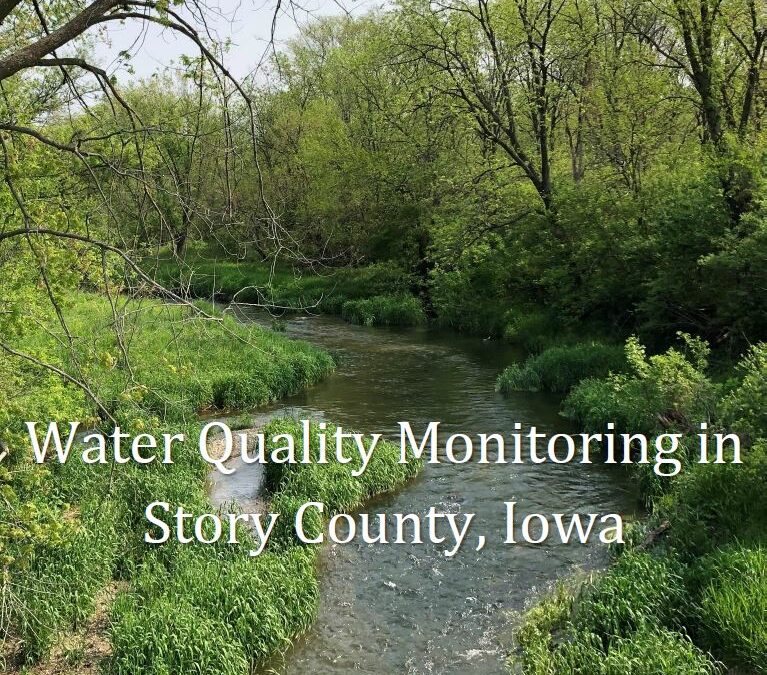
Water quality results for 2023 in Story County
Our 2023 Annual Report is now available with results of both volunteer and lab testing of water quality in lakes and streams in Story County. The 56-page report can be navigating by clicking on headings in the table of contents or by using the “Bookmarks” feature in your PDF reader. Below are some of the key findings.

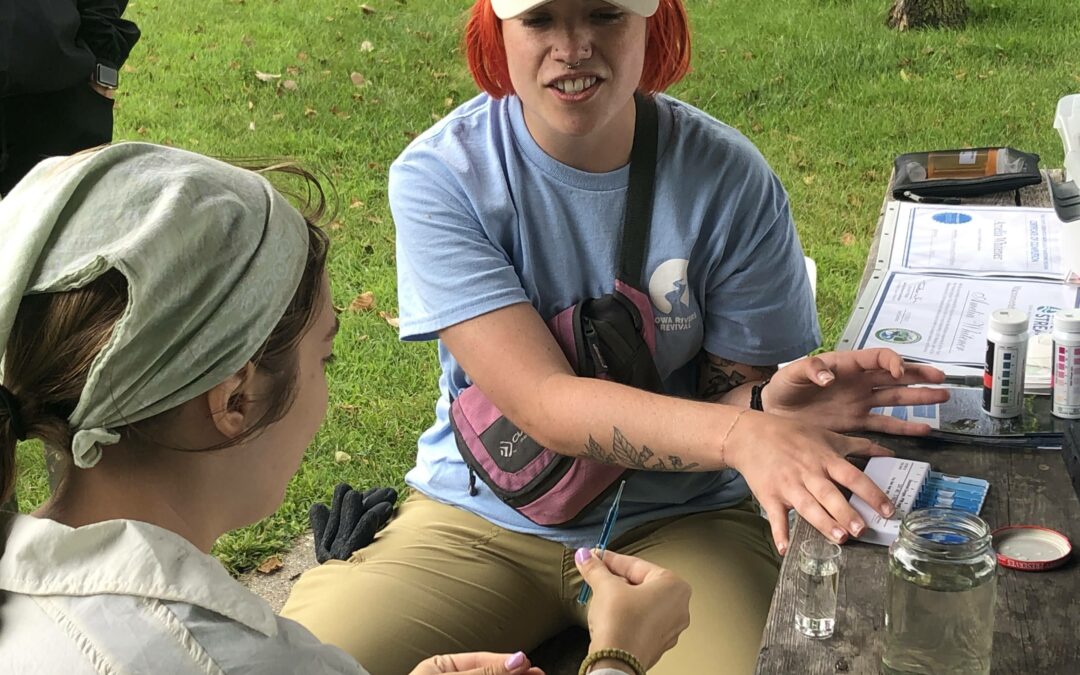
The volunteer program continues to grow and improve in consistency.
- 49 volunteers entered 969 data sheets into the Clean Water Hub this season.
- Many volunteers are monitoring their assigned site biweekly, with 20 sites sampled at least 20 times.
 under magnifying glass")
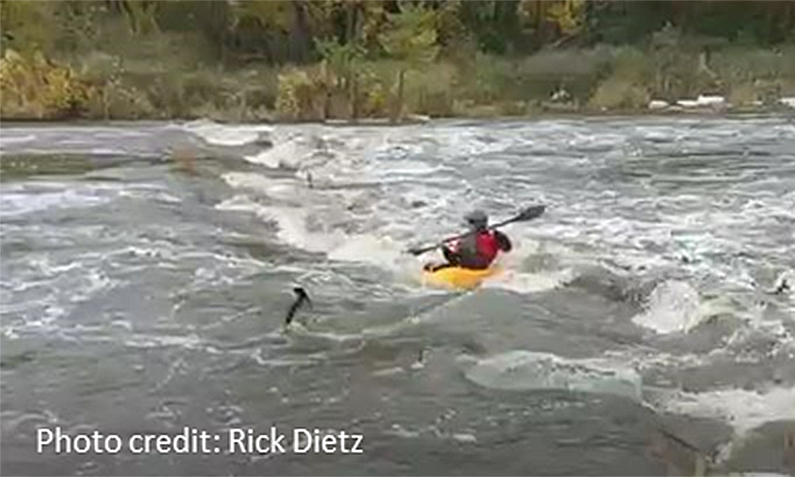
This was a challenging year for fish and aquatic insects.
- In addition to many creeks drying up, volunteers observed dissolved oxygen drop to low levels at 53% of stream sites.
- Biological surveys showed mixed results, with some streams scoring poorly but sensitive insects like mayflies present in others.

E. coli bacteria levels in streams remained high.
- All thirteen streams with enough data to evaluate this season exceeded the primary contact recreation standard. Three streams exceeded the secondary contact recreation standard: (West Indian Creek, College Creek, and Ballard Creek.
- However, over the last four years, most sites on the South Skunk River meet the standard when there is enough water to float a canoe.

Wastewater treatment plants are not yet capable of removing some of the pollutants we monitor, and can have a large influence during drought when effluent is less diluted.
- Effluent from the old sewage treatment plant in Nevada was found to be a major source of E. coli bacteria. The new plant, currently under construction, includes a disinfection system that should address the problem.
- Stream sites downstream of sewage treatment plants tend to have elevated chloride and phosphate.

The encouraging trends we noted in the 2022 report held up with another year of data. Water quality trends are often driven by weather, but we pulled out subsets based on streamflow to remove some of this influence.
- E. coli in the South Skunk River below the Ames Water Pollution Control Facility has improved relative to the pre-2014 baseline period, especially during dry conditions when wastewater has the greatest influence.
- Nitrate in the South Skunk River below the confluence with Ioway Creek improved relative to the pre-2014 baseline period, even after excluding dry periods. This pattern is consistent with improvement from conservation practices.