


Tips for Creating a Native Landscape in Iowa
Creating a native garden or space seems nice, but how do you actually do it? Here are some tips to help you get started in planting a native garden that not only benefits our wildlife and your mental health, but is also manageable and fun.

Assess Your Site
Note how much sun the site gets
- Full sun (6+ hours), part-shade (3-6 hours), and full shade
- South and west-facing slopes are typically hotter and drier
- North-facing and low-lying areas are typically cooler and wetter.
Dig test holes and feel the soil
- Is it heavy clay that holds water, a loamy garden soil, or sandy/loess that drains quickly?
- Do you have seasonal standing water or a high water table?
- Does it puddle for days after it rains?
What is your primary goal for this site?
- Is it for pollinators, wildlife habitat, or just to look at?
- While all of these things can happen in one garden, knowing your goal helps narrow down what species you will plant. For example, more milkweed would be added if your goal is to support Monarchs, whereas if your goal is wildlife habitat, you would plant more grass and shrubs.
Design tips for attractive and functional plantings
Use layers and repetition
- Tall grasses and asters in the back, mid-height coneflowers and goldenrods in the middle, low sedges and groundcovers in the front
- Repeat plant groups to create rhythm and a more manicured look
Use transition zones
- A buffer strip of low natives or mulch help reduce weed invasion from your lawn and creates a nice visual boarder
- Consider a mown or gravel pathway to define edges. Stones and brick make wonderful edges as well.
Add features
- Bright, colorful plants surrounded by rocks or mulch adds an exciting touch
- Water ponds and fountains not only add visual interest, but create micro environments for critters and a drinking source for pollinators and wildlife

Planting
Site preparation
- Remove vegetation from site
- For small beds, you can use layers of cardboard or newspaper covered in compost/mulch or sod-strip to reduce weed competition
- For larger prairie conversions, consider an herbicide treatment to kill all of the existing vegetation
Decide on seed, plugs, or containers
- Seed mixes are cost-effective for large areas but require more time and weed control
- Plugs are more expensive but cut down on establishment time
- Using containers, like pots or raised beds, is a great option if you are living in an apartment or want to move your flowers around
Timing
- Late Fall seeding mimics natural cycles and often gives higher germination due to many native plants needing cold stratification
- Early Spring seeding is another option once soils can be worked however it still needs to be cold enough outside that seeds will germinate
- Plugs can be planted throughout the Spring season as long as the threat of frost is gone.
Planting plugs
- Plant at the same depth as the nursery pot, firm the soil to remove air pockets, and water deeply
- Space forbs roughly a foot apart, grass 2 feet apart, and grass to forbs 1.5 feet apart
- Apply 1-2 inches of mulch in new plantings to reduce weed pressure.
- Keep mulch away from stems
- Water weekly for the first month, then taper according to rainfall.
- Reduce watering after the first year

Maintenance
Native plants Sleep, Creep, and then Leap
Year One: Sleep
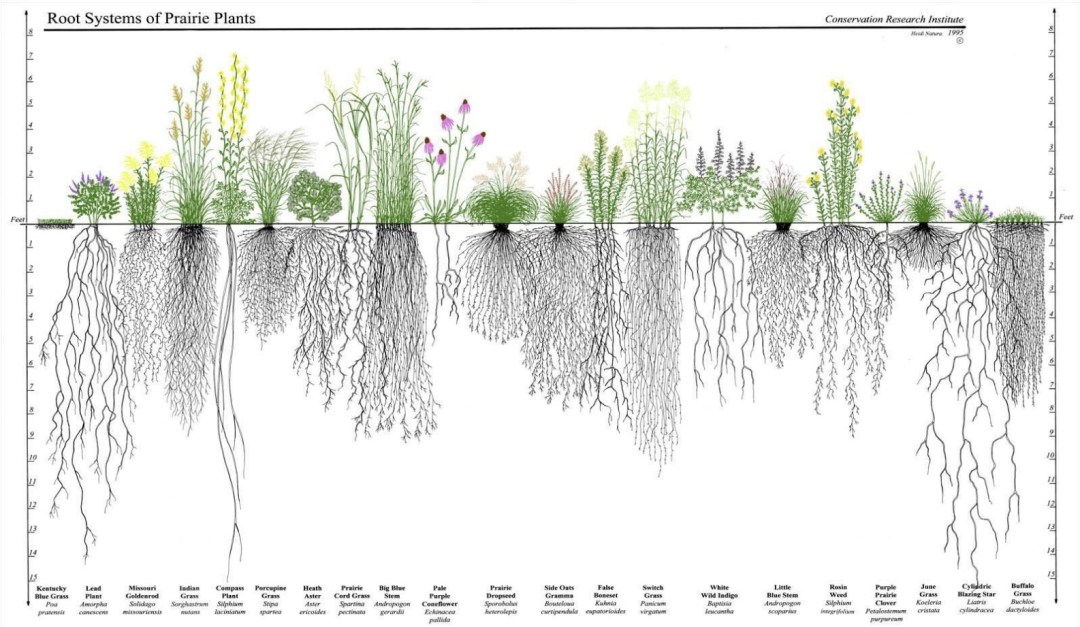
- Native plants usually have extensive root systems and they start their lives developing these roots
- Expect slow above ground growth which can lead to more weeds, and the need for targeted weeding
- For larger areas where hand weeding is not feasible, mow vegetation to 6 inches in height to reduce weed competition and allow sunlight to reach the soil.
Year Two: Creep
- Plants begin to show growth above ground and form clumps
- Continue selective weeding
- Again, for larger areas, mow vegetation but this time to 8 inches in height


Year Three: Leap
- You should see blooms and maintenance should be reduced
- Note that each species is different and can take longer to establish This is a general timeline
- Leave the stems and skip fall/spring clean up!
- Stems and leaves provide great overwintering habitat for our native pollinators and wildlife
- If you must clean up, leave 15 inches of stem standing for native bees to nest. You can rake leaves into a pile to leave
- Prescribed burning every 2-4 years can rejuvenate growth and control woody encroachment.
- This is not always an option, so mowing also helps control woodys and simulates grazing
- Always use certified burn managers and follow local regulations and safety protocols
- You should see blooms and maintenance should be reduced
Takeaways
1. Start small
Convert a front bed or create a rain garden to learn species behavior before scaling up. You can always expand over time.
2. Right species for the site
Dry-loess, mesic prairie, wet rain garden, or shade understory each require different plants.
3. Commit to 3-5 years
Native plants take time. A plan that addresses initial weed control, adaptive interventions, and a mowing/burning schedule for larger plantings makes sure that maintenance is not forgotten.
Planting a native landscape is an investment in beauty and biodiversity. With careful planning, you can create a landscape that thrives in Iowa’s climate, supports native wildlife, and reduces inputs over time.
Comments

Ioway Creek Could Lose Protection
Ioway Creek Could Lose Protection
written by Dan Haug, Watershed Coordinator for Story County Conservation
EPA’s latest attempt to redefine “Waters of the United States” could strip protections from Ioway Creek in Ames. Who knows how many others are at risk! Please make public comment by October 9.

Which streams and which wetlands are protected by the Clean Water Act? That depends on how courts and environmental agencies interpret the phrase “Waters of the United States.”
Federal agencies have interpreted the phrase too broadly in the past, and the Supreme Court has pushed back. The issue in Sackett v. EPA, the issue was not whether filling in a wetland for a house would impact water quality in Idaho’s Priest Lake, it was whether the federal government had overstepped its authority in asserting jurisdiction over a wetland with no obvious connection to a navigable water body. All nine justices agreed that it had, although they disagreed about the treatment of “adjacent” wetlands.
However, in its latest attempt to comply with the Supreme Court ruling, the Trump Administration’s EPA has interpreted the phrase too narrowly, leaving substantial uncertainty about which waters are covered and potentially harming water quality and fisheries in streams across Iowa.
This is Ioway Creek.
As you can see from the picture, it’s a navigable water body in the sense that we regularly organize canoe trips on it. It’s a solid blue line on the topographic map. However, it dried up three times in 2021: on August 19, from September 11 to 29, and from October 8 to 12. There was a drought that year, but it was classified as “Severe.”
If you read the find print in EPA’s latest proposal, that means it would be classified as “intermittent” under the latest definition being considered by the EPA. That means that it’s not a waters of the United States. That means a federal dredge/fill permit would not be required to build in Ioway Creek, although state and local floodplain permits would still be required. I think a federal permit would still be required to discharge pollution into Ioway Creek, but it might affect the terms of the permit—i.e. allowing higher E. coli concentrations in the effluent.

It doesn’t do much good to ask the EPA to protect ephemeral streams and prairie pothole wetlands. The Supreme Court has ruled that this can only be done at the state level. But we need to stop this ridiculous game of telephone where you can start with “navigable waters” and “water quality” and end up regulating manmade ponds to protect waterfowl, or end up stripping protection from a navigable river!
The Fine Print I Find Objectionable
Under this supplemental option, “relatively permanent” would be defined to mean “perennial bodies of water.” The definition would also state that “A body of water does not lose its relatively permanent status if it dries up as a result of anomalous events such as drought or dry spell. A body of water also does not lose its relatively permanent status if it dries up for no more than a single period of up to 30 consecutive days in any given year as a result of non-anomalous events resulting in a temporary interruption such as low tide or a regularly occurring dry spell.” … When flow is interrupted for more than a single period in any given year, and the interruptions are non-anomalous and ordinary for that water body, the agencies would consider this to be an ephemeral or intermittent feature even if each period of interruption does not amount to 30 consecutive days. For instance, if flow is interrupted for two periods in any given year, and each period consists of 10 consecutive days of no flow, the water body would not be jurisdictional when these interruptions are non-anomalous.
The U.S. Drought Monitor uses four levels of drought: moderate (D1), severe (D2), extreme (D3) and exceptional (D4). The agencies are considering implementing drought under this supplemental option such that only extreme (D3) and exceptional (D4) droughts would qualify as anomalous drought conditions that can temporarily interrupt perennial flow, and can extend continuously across no more than a five-year timeframe, after which the drought condition would be nullified for purposes of identifying “relatively permanent” waters, and that water would no longer be jurisdictional under its ordinary conditions as the interruption has ceased to be `anomalous.’

Iowa’s E. coli Problem: Tracking the Source with DNA Forensics
It’s no secret that Iowa’s waters are in rough shape. Nitrate is on the news, beaches are closed, the list goes on. Just take a look at the Iowa DNR Impaired Waters report for 2026. As the graph on the right shows, over half of the assessed river and stream reaches in the state are impaired. That means the water body doesn’t meet federal standards for its designated use. That figure doesn’t even include the 1099 “Not Assessed” segments or the 254 “WINOFI” segments (waters in need of further investigation).
What might surprise you is the leading cause of the impairments. It’s not nitrate or toxic algae or even pesticides. It’s E. coli, and it’s not even close. Of the 747 individual impairments cited in the 565 impaired segments, roughly 430 were due to E. coli (listed in the report as “indicator bacteria”).

Iowa DNR Impaired Waters Assessment Results. Top chart shows the results for assessed streams, including WINOFI (waters in need of further investigation). Bottom chart shows assessment status for all waters.
Source: Iowa DNR 2026 305(b) Assessment Summary DRAFT.

Iowa DNR Impaired Waters Assessment Results. Chart shows count of impairment causes across all impaired streams and river segments. “Category” refers to EPA Integrated Report Categories: *Category 4: Waterbody is impaired or threatened but a TMDL (total max. daily limit) is not needed. Category 5: Waterbody is impaired or threatened and a TMDL is needed.
Source: Iowa DNR 2026 305(b) Assessment Summary DRAFT.
What about Story County?
While the number of state-monitored stream segments has increased in recent years, the health of most segments remain unknown. To help fill this data gap, Prairie Rivers of Iowa (PRI) samples local streams and rivers with help from the City of Ames and Story County Conservation.
This summer we took 60 samples from 13 Story County streams. Fifty-eight of them exceeded Iowa’s single-sample maximum for primary (A1) and children’s (A3) recreation, which is 235 E. coli/100 mL. Thirteen of those also exceeded the much looser secondary recreation (A2) maximum of 2,880/100 mL. Three were too high to measure, above 23,000 MPN per 100 mL.
The Iowa DNR does not recognize PRI’s E. coli data as sufficient quality to assess stream status because we do not meet Iowa’s credible data requirements for an approved quality assurance plan. If it did, our results suggest all 13 of our streams could be added to the impaired waters list.
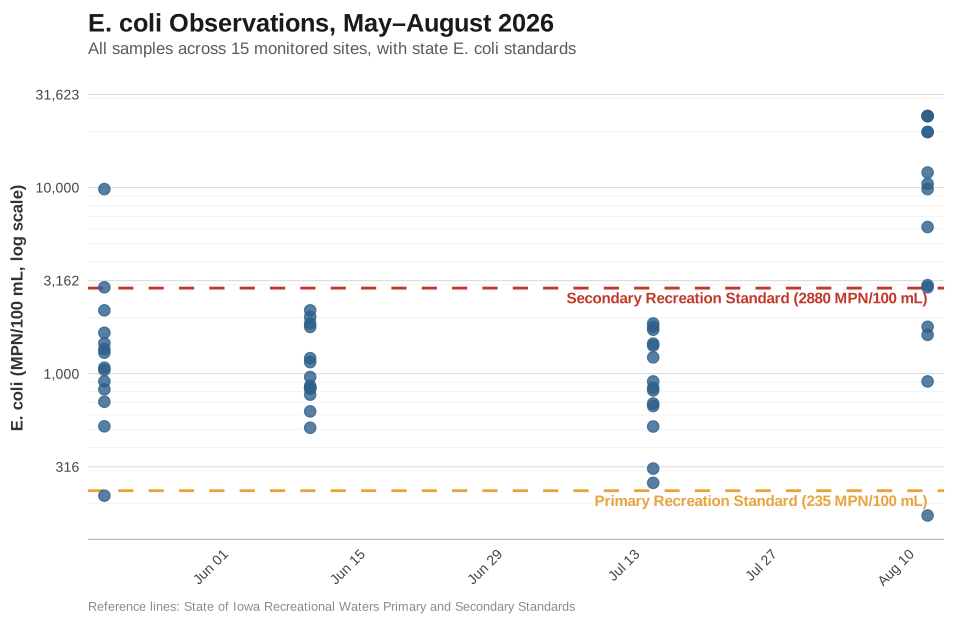
E. coli data from 15 sites regularly monitored by Prairie Rivers in Story County. The dashed lines represent the Iowa DNR’s recreational safety standards based on designated use categories.
What does this mean for human health?
E. coli is generally viewed as a proxy measure of fecal contamination and risk of illness. So high E. coli, everywhere, all summer, suggests a near ubiquitous distribution of fecal material and associated pathogens in our rivers and streams. Sounds disgusting, right?
According to the DNR, however, the risk to human health is limited. “The designated recreational uses of many Iowa waters—especially rivers and streams—are impaired by high levels of indicator bacteria, but reports of waterborne illness related to these high levels of bacteria have been extremely rare in Iowa over the last 40 years.” To be fair, not all E. coli strains that show up in tests are pathogenic, and actual human exposure in many of these waters is limited. Further, it turns out that some strains of E. coli can persist outside of the gut, so E. coli doesn’t always signal fecal contamination (source). Still, the risk of illness does rise and fall with E. coli levels, and the EPA standards set to prevent illness are being violated time and time again.
What can we do?
In order to design solutions, we first need the answer to a critical question: where is the E. coli coming from?
Is this a human waste problem like non-permitted discharge or aging municipal sewers? Is it agricultural: cows in streams, manure runoff from fields, or illegal discharge from CAFOs? Or could it be the unavoidable consequence of urban and suburban ecology? Concentrated populations of humans, dogs, and wildlife (looking at you, deer and raccoons) produce a lot of waste that might be driving the problem.
Each source requires a different solution, and we can’t mitigate contamination if we can’t identify the source. So who is responsible?
This is the question Prairie Rivers set out to answer.
DNA Forensics: Microbial source tracking with qPCR
Recent advances in genetic technology have made it possible to track the source of E. coli by identifying DNA fragments floating in our streams and rivers. All you need to do is to collect a water sample from a stream of interest, filter it through a specialized filter designed to capture DNA, and send it to a lab with the proper tools and tech.
The technology in question, called quantitative PCR, or qPCR, is able to count DNA fragments and identify the species they came from. This tells us which species are present in a stream and how much DNA they are shedding. By linking this data with E. coli counts, we can infer the most likely source or sources at each stream segment.
We sampled 23 sites on July 15, 2026. Most sites are part of our monthly monitoring routes, but additional sites were added based on public interest and suspicion of contamination. We included a sample of effluent from the Ames Waste Water Treatment facility to control for contributions of sterilized DNA. Samples for qPCR were screened based on initial E. coli levels. Samples with highest E. coli were selected for DNA source tracking. Because this was a single sampling event, the results are a snapshot, and sources can shift with season and weather.
One important caveat about qPCR: it does not identify every single species present in a sample. Rather, we have to select target species that we think are likely contributing DNA beforehand. This means that non-target species could be contributing fecal material, but we won’t be able to tell. For example, we did not include fish in our targets species list, and so we found no fish DNA, despite the fact that fish DNA is certainly in the water. We were only able to test for standard targets species, including humans, livestock species, and dogs. For a subset of samples(6/15), we were able to test for wildlife- raccoon, deer, Canada geese- in addition to the standard species.
Results
Interactive Map
This map shows where in Story County we sampled, the population of E. coli at each site, the categorical breakdown of the DNA sources, and the species level DNA counts.
Humans and Cows Everywhere

Color-coded barchart showing source species presence vs total number of sites, and categorical description of source strength based on number of DNA copies present.
Humans, present at 15/15 sites, and cows (13/15) were the most widespread source species across the county. Humans and cows were also the only two species contributing enough DNA at a single site to be considered “spill/major leak” level sources. Chicken DNA was relatively common, though mostly in trace amounts. Both sheep and swine were rare, with each rising into the “clear source” category only once. Dog DNA was found widely in our samples but did not represent major sources of fecal material. Raccoon and deer were significant contributors in every sample tested for wildlife DNA, while Canada geese only showed up in one site.
A Closer Look

The boxes represent the middle 50% of that species’ results (from the 25th to the 75th percentile). The line inside the box marks the median. The whiskers (the thin lines extending from each end of the box) show the typical range of the data beyond the middle 50%. The dots are every individual sample result.
This chart shows a closer look at the distribution of DNA copies by species across all sampling sites. As noted before, humans and cows contributed much more DNA, on average, than any other species. Raccoons and deer were close, despite only being tested for in a subset of samples. Dogs, sheep, and pigs barely registered in most samples. Chickens did make an appearance, but certainly not enough to move the needle on E. coli.
Something Might Be Missing.

This chart shows the total number of DNA copies, the species categories they came from, and the corresponding E. coli data from that site.
Here we see how much DNA is in the water and how well that connects to E. coli levels. In our data set, the relationship is inconsistent. There is a good correlation in the first few sites, with E. coli values following total DNA. This suggests that DNA can be connected to E. coli to infer the source.
However, in several instances, E. coli was very high, while DNA copy counts were relatively low(e.g. College Creek, Clear Creek, S. Skunk at Story City, and Bear Creek). This could suggest the presence of a significant source species that we did not test for, or could point toward difficulties in drawing direct connections between environmental DNA and E. coli populations. It’s possible that E. coli populations exist in our rivers and streams independent of fecal contamination. We’ve seen evidence of this on our beaches, so why not in our streams?

Whose Poo? Whose Problem? Everyone’s.
Humans
It should probably not come as a surprise that human DNA occurred in every single sample. We are rather abundant and, despite our best efforts, never perfect in keeping our waste out of our water – especially in urban areas where humans are concentrated. Samples of the treated Ames waste water effluent showed human DNA, so it’s not like human DNA is necessarily a red flag. We did, however, find some red flags.
Specifically, what’s going on in Ballard Creek at Cambridge? E. coli colony counts there are always among the highest in our long term monitoring data set, and here we found more human DNA than DNA from all other animals combined at any other single site in the data set. With that much DNA, plus consistently high E. coli, the issue bears more attention. Could sewer water be escaping into Ballard Creek through aging city infrastructure? Could unregulated septic discharge in the watershed be responsible? For now, it’s hard to say for sure, but we will be following up with repeated sampling to hone in on the source.
Livestock
Many of our more rural sites were dominated by DNA input from cattle, most conspicuously at Keigley Branch. With multiple eyewitness reports of cattle wading there, it’s no surprise that both E. coli colony counts and cattle DNA were as high as they were. Manure deposited directly in a stream is a potent E. coli source, and the bacteria can persist and even multiply in manure and streambed sediment.The source was so potent it seems possible that it’s responsible for E. coli populations as far south on the S. Skunk as North Riverside Park, in Ames. Cows are known to carry pathogenic strains of E. coli, so this is a major concern.
Notably absent from the livestock data was pig DNA. With the exception of a few DNA copies in the Ames waste water treatment effluent (probably from our diets!), we saw almost zero trace of swine in any of our samples. This could simply reflect the timing difference between our sampling event and manure application. Most manure is spring or fall applied, and as we noted earlier, field manure is a much less potent source of E. coli than direct deposit, especially months after application. On the other hand, perhaps we are seeing the results of responsible manure use. When applied at the right rate, time and place, with run-off mitigating practices like cover crops and no-till, manure can be all upside.
Wildlife
Would you believe it? Wildlife, namely raccoons and deer, are the number one contributors of DNA in at least three streams in Story County. The South Skunk at Story City, along with College Creek and Clear Creek in Ames, are rife with wild droppings.
As many Iowans are well aware, deer and raccoon populations are very robust today, largely driven by removal of predators and favorable habitat creation in urban and suburban environments (did someone say trash panda?). They live in greater numbers in small fragments of habitat, so they, along with their fecal matter, end up extra concentrated in built environments. A stream in a large, undisturbed forest probably wouldn’t show E. coli this high from wildlife alone. What we’re seeing is wildlife packed into fragmented urban habitat.
Conclusions
E. coli is undeniably widespread and highly abundant in much of Iowa, though risk to human health isn’t exorbitantly high. The sources vary widely between locations and over time, so it’s difficult to point fingers at any one source. If we want to meet state standards for recreation in all of our waters, we have to approach the issue on all fronts, a task much easier said than done. Even if we could address aging city infrastructure and failing private waste disposal systems, all while working to minimize agricultural inputs, we still won’t have dealt with wildlife, which as our data shows, is a major contributor.
We don’t like E. coli, and we like to raise hell when it comes from people and livestock, but what does it say about our standards for E. coli when deer and raccoons can push water quality outside of the acceptable range? What does it say that risk to human health remains low despite shocking statistics? Maybe it says that we need to approach these data with a nuanced understanding of E. coli, fecal contaminants, and risk. We need to balance the sensationalism around fecal contamination and sickness with actual risk and exposure, all while finding reasonable compromises to improving water quality across the board.
Further Reading
You can find more info on E. coli and surrounding regulations at these sites:
https://programs.iowadnr.gov/adbnet/Assessments/Summary/2026
https://programs.iowadnr.gov/adbnet/Docs/Codex/Designated%20Uses
https://programs.iowadnr.gov/adbnet/Docs/Codex/Impaired%20Waters
Acknowledgements
This work was made possible by contributions from the Izaak Walton League – Panora Chapter, the Outdoor Alliance of Story County, Story County Soil and Water Conservation District, and the Water Foundation.
10 Native Shade Plants for Your Yard
Native plants are a wonderful addition to any landscape. Here in Iowa, we often times focus on tallgrass prairie plants. This is because historically, most of Iowa was just that; a tallgrass prairie. These plants usually require full sun, but in our changed landscape, that isn’t always possible. I am often asked what people can do in their shaded yards, so I made an easy-to-read list to answer this question!
All of these plants are native to Iowa and bring many benefits to the ecosystem! Some of these benefits are increased water infiltration, providing habitat and food for local wildlife, including pollinators, and reduced maintenance compared to traditional turf lawns.

Columbine
Aquilegia canadensis
- Sun: Full to Shade
- Soil: Wet to Dry
- Height: 1-3 ft
- Bloom: Apr-Jun
- Host Plant: Pink-patched Looper Moths, Columbine Duskywings
This flower is long and tubular, lending itself to wildlife with long mouth parts like long tongued bees and Ruby Throated Hummingbirds. These blooms mean Spring has sprung and welcomes our pollinators with bountiful nectar and pollen when those resources are scarce. These short-lived perennials will readily self seed and adapt to most conditions.

Solomon’s Seal
Polygonatum biflorum
- Sun: Partial to Shade
- Soil: Medium to Dry
- Height: 1-3 ft
- Bloom: May-Jul
As a spring ephemeral, it supports our native bees and other pollinators as they emerge from their overwintering habitats. The creamy white blooms dangle below the broad leaves like little bells. Once pollinated, it produces circular blue fruits that songbirds love to snack on.

White Snakeroot
Ageratina altissima
- Sun: Partial to Shade
- Soil: Moist to Dry
- Height: 1-4 ft
- Bloom: Jul-Oct
- Host Plant: Clymene Moth, Hitched Arches
This fall blooming plant provides needed nectar resources for bees getting ready to overwinter. The blooms are white, small tubular structures that bees and butterflies alike enjoy. The clusters of flowers provide a nice landing pad for butterflies to rest on.

Tall Bellflower
Campanula americana
- Sun: Partial to Shade
- Soil: Moist to Medium
- Height: 3-6 ft
- Bloom: Jul-Sep
- Biennial
Native bumble bees, leaf-cutter bees, butterflies, and skippers love its nectar! The Tall Bellflower is a stunning addition to any native garden and will steal the show with its many blooms.

Sweet Joe Pye Weed
Eutrochium purpureum
- Sun: Partial to Shade
- Soil: Moist to Dry
- Height: 4-6 ft
- Bloom: Jul-Sep
- Host Plant: Plume Moth, Slender Flower Moth, Joe Pye Weed Borer Moth, Bold-feathered Grass Moth
This plant is deer resistant and attracts several butterflies like Monarchs and Swallowtails. it is typically robust and sturdy meaning it will stay upright with no need to stake. They produce huge clusters of nectar rich blooms that attract many pollinators.

Yellow Jewelweed
Impatiens pallida
- Sun: Full to Shade
- Soil: Wet to Medium
- Height: 2-5 ft
- Bloom: Jul-Oct
Also known as Touch-me-nots because their seed pods explode when touched! These flowers are annual and will spread seeds readily. While it will grow in a variety of conditions, it prefers mucky soils. They pull pollinators of all types and grow well along streams, ponds, and bogs.

Virginia Wildrye
Elymus virginicus
- Sun: Full to Shade
- Soil: Wet, Moist
- Height: 2.5 ft
- Bloom: Mar-Apr
Good native habitat has both flowers and grasses. This plant provides important hiding spots for insects and wildlife. It is a native cool season grass found in wet conditions. They are great for erosion control since it has an extensive root system.

Virginia Bluebells
Mertensia virginica
- Sun: Partial to Shade
- Soil: Medium
- Height: 2 ft
- Bloom: Apr-May
The blooms provide early season nectar resources for queen bumble bees and other pollinators. These subtle beauties are only around for a short time in Spring and starts dormanc mid Summer. While they are here, they are covered in pollinators from Swallowtail butterflies to huge bumble bees.

Wild Ginger
Asarum canadense
- Sun: Shade
- Soil: Medium
- Height: 6 inches
- Bloom: Apr-Jun
This creates a great ground cover that stays green all season! The very unique brown-purple flowers hide under the foliage. It spreads through rhizomes and seeds. The hidden blooms attract pollinators with a sweet fragrance although the flowers can also self pollinate. It tolerates deer browsing, erosion, and wet soils.

Wild Geranium
Geranium maculatum
- Sun: Full to Shade
- Soil: Medium
- Height: 1 ft
- Bloom: Apr-Jul
This woodland flower is found naturally in rich, mesic forests, but will adapt to different condions. It is easy to grow and very showy with its many pink blooms. It is a bushy plant and great habitat for our native wildlife.

Mussel Relocation at Hannum’s Mill Dam
Buttons and Pollution: Mussels in Peril
Fresh water mussels are among the most threatened group of animals on earth. In North America, over 70% of the continent’s roughly 300 species are threatened, endangered, or extinct. Iowa alone has lost twelve of its fifty four native species, with nine more endangered and six threatened. Why?
The problem began in the late 1800s. Mussel shells became prized for making pearl buttons, driving the creation of a massive industry in Iowa. Muscatine (aka Pearl City) was the biggest producer of pearl buttons in the world, capable of churning out 1.5 billion buttons a year. By 1900, the demand for shells destroyed local mussel populations. Soon after, plastics would displace pearl buttons, and the industry, along with its demand for shells, dried up.
Despite the ultimate failure of the pearl button industry, mussel populations are still imperiled across the state. As relatively immobile filter feeders, they are completely dependent on good quality water to survive. Erosion, nutrient pollution, and low oxygen all negatively affect mussels. So when water quality is poor, as it is in most Iowa streams and rivers, mussels suffer.


Locally threatened species Creek Heelsplitter (left/top) and Cylindrical Papershell (right/bottom)
The Mission: Save Some Mussels

Hannum’s Mill Dam
Hannum’s Mill Dam
In preparation for an upcoming modification of Hannum’s Mill Dam on the South Skunk River just north of Ames, IA, Story County Conservation staff, DNR biologist Jennifer Kurth, and volunteers set out to find and relocate mussels downstream of the dam. While dam removals and modifications can ultimately benefit mussel populations, short term changes in water levels and disturbances to sediments can leave mussels exposed to the air or fatally buried in silt. By relocating them before construction begins, we can ensure minimum harm and greater future population success.
The crew set out on foot, searching for mussels visually and by scouring the gravel and sand by hand. Mussels typically bury themselves vertically in the substrate with their “mouths” – more accurately called intake siphons – poking up into the water to collect food from the water. In the video below, you can see Story County Conservation Tech Kallie Webber unearth a Plain Pocketbook mussel with its foot extended, a fleshly, muscular organ used to dig and hold on to the substrate.

By the end of the afternoon, the team managed to collect more than 450 mussels, including two locally threatened species, the Creek Heelsplitter and Cylindrical Papershell. Finding these species highlights the importance of this work. By relocating them prior to dam modification, we can give them a chance to contribute to the continuation of their species.

Volunteer and Prairie Rivers board member Rick Dietz helps sort mussels by species.
If you’re interested in this kind of work, consider volunteering for this year’s Mussel Blitz on August 17-19. Reach out Jennifer Kurth with the DNR Watershed Improvement Program: 515-639-8464 or Jennifer.Kurth@dnr.iowa.gov
A big thank you to Story County Conservation and the Iowa DNR for making this event possible.

Pollinator Week: Its History & Why it Still Matters

History
Pollinator Week was started by and is managed by Pollinator Partnership. In 2008, the U.S. Senate’s unanimous approval and designation of a week in June as “National Pollinator Week” marked an essential step forward in pollinator conservation.
Pollinator Week has now grown into an international celebration, including Canada, Mexico, and some countries in Europe! This event promotes the valuable ecosystem services, like pollinating the 87% of flowers that require assistance, provided by bees, birds, butterflies, bats, beetles, moths, wasps, and flies.
People can participate and help raise awareness about the importance of pollinators by hosting an activity during Pollinator Week. Many have already pledged to Pollinator Partnership to continue promoting pollinator health.
“Through the numerous virtual and in-person gatherings, webinars, planting sessions, garden and farm walks, and monument lightings, Pollinator Week 2026 is geared to be the busiest and best one yet!” – Pollinator Partnership


Why it’s Still Important
Pollinator Week is still incredibly important to pollinator conservation. It highlights the role that bees, butterflies, and other insects play in our food systems and everyday lives. Not only are they beautiful creatures, they also contribute 100s of billions of dollars globally every year by pollinating our food crops. This week is filled with educational events and is full of advocating for wildlife.

There are many ways to get involved!
Many of these events and activities are family-friendly and made for young and old alike. Everyone is invited to participate.
Online
- Vote for pollinator-friendly policies
- Tell your pollinator stories on social media using #PollinatorWeek
- Highlight pollinators on your blog
- Register your pollinator habitat
- Attend an educational webinar
- Screen a pollinator film
At Home
- Plant native plants
- Pollinator Friendly Ames has some great resources for planning
- Sign the Pesticide Pledge by Good Neighbor Iowa
- Provide clean water sources
- Host/Join a nature walk
- Build a bee house
- Guide by Michigan State
- Turn off your outdoor lights at night for nocturnal polliantors
- Leave your leaves for overwintering pollinators

Frequent Fliers: Birds on the Move
This is perhaps my favorite time of year! Flowers are blooming. Trees are getting their leaves back. The weather is getting nicer. Animals are emerging. And one of my favorite things…the birds are back! I absolutely love waking up in the morning to the birds chirping.
Millions of birds are making the lengthy journey from their wintering areas to their summer nesting grounds. Some may choose to stop here and make Iowa their summer home. Others though, may be traveling as far as northern Canada and the subarctic! Sometimes they may even be flying from as far away as South America!
This is an exciting time of year for anyone who is interested in our avian friends. The Cornell Lab BirdCast estimated nearly 1.5 million birds flew over Iowa in a single night, and nearly 207 million flew over the United States on the same night, April 29-30!

Iowa is located along the Mississippi River flyway, a migration highway for birds that extends from Canada to the Gulf of Mexico. Iowa’s variety of habitats, including forests, wetlands, prairies, and agricultural land provide an array of resources for the migrating birds to rest and refuel. Saylorville Reservoir, Rathbun Lake, and Neal Smith National Wildlife Refuge are all major stopovers along the route. You may have noticed American White Pelicans along the waterways or songbirds like Baltimore Orioles near homes and parks recently. These are just two of the hundreds of species that either migrate through or call Iowa home every year.

(American White Pelican, Cornell Lab)

(Baltimore Oriole, Cornell Lab)
Migration is not only exciting, but also important. Birds play an essential role in pollination, seed dispersal, and pest control. Without birds, our ecosystems would not be the same. The Ruby-throated Hummingbird is Iowa’s only bird pollinator, and you might even be able to catch a glimpse flitting around your feeders and flower gardens. The Northern Cardinal, perhaps one of Iowa’s most recognizable birds, is just one of many avian species that eat fruit and seeds and help disperse those seeds by passing them through their digestive system intact. Other birds, like the Black-capped Chickadee, may cache seeds for later. Some birds, like Northern House Wrens, eat insects, which can help control pest populations.

(Ruby-throated Hummingbird, Cornell Lab)
Despite the beauty and importance of our avian friends, bird populations across North America are declining rapidly, with reports of up to 3 billion birds lost since 1970. Some contributing factors include habitat loss, outdoor cats, collisions with windows, and pesticides. Many of these same factors are also contributing to the decline of other species, like pollinators.
There is hope though! You can help birds in several ways. One way is by enhancing bird habitat through acts like establishing a Conservation Reserve Program (CRP), creating a habitat for pollinators, or
planting or keeping trees. Planting native plants and trees will not only help our pollinator friends like butterflies, bees, and other insects, but will also help provide food and shelter for birds that rely on those
resources. If you have ever experienced a bird hitting your window, they might be seeing the reflections of vegetation or the sky, or they might be seeing house plants through the glass. Installing mosquito screens on the outside of the window or putting decals, stickers, sun catchers, or even sticky notes on your window can help reduce bird collisions.
There are many resources available for those of us that are interested in birds, and if you’re anything like me, they might be some of your favorite apps or resources, especially this time of year.
Check out a few of them below!
- Cornell Lab All About Birds
- Cornell Lab BirdCast
- Cornell Lab Merlin
- Audobon
- Audubon Bird Migration Explorer
- Iowa Ornithologists’ Union
- Iowa Wildlife Federation
- Bird Friendly Iowa
- iNaturalist

Iowa Women In Conservation
March is not only Iowa History Month, but also Women’s History Month!
While women have not always had recognition for their efforts, they have been involved.
Ada Hayden, 1884 – 1950
Photo from the Ada Hayden Collection, Iowa State University Library Digital Collections
One of the most well-known women in Iowa Conservation, Ada Hayden, was born in 1884 and grew up on a farm as an only child. Her home was in Franklin Township in Story County. She attended Iowa State College, which was later renamed Iowa State University. In 1908, she received a bachelor’s degree in botany. After receiving her master’s in botany from Washington University in 1910, she moved back home and worked toward getting her Ph.D from Iowa State College. In 1918, she was the 1st woman and 4th person overall to recieve a doctorate from ISU.
This was only the beginning of her passion for prairie. After her Ph.D, she worked as an assistant botany professor at ISU. In 1934, she became the curator of the herbarium on campus. She concentrated on prairie plants and is said to have created “possibly the best published native flora survey… of any part of Iowa”. She added over 14,000 specimens to the herbarium, many of which were from her family land.
In the 1940’s she began focusing more on prairie preservation. This however, is far from the first time that she thought about saving prairie. In 1919, she wrote an article about the importance of setting aside prairie for permanent preservation and research. She believed that prairie preserves serve as a living museum and field lab for scientists. In 1944 she helped write a report identifying areas of perservable prairie in Iowa.
In 1950, at the age of 65, she died of cancer. Today, there is a beautiful prairie and park in Ames, IA, named after her.
Herma Albertson Baggley, 1896 – 1981
Herma was born in Inwood, Iowa, on October 11th, 1896. She attended the University of Idaho and, while there, received her bachelor’s in botany with a minor in philosophy in 1921 and a master’s in botany in 1929. Over the summer in 1929 and 1930, she worked at Yellowstone National Park, giving talks about Old Faithful. Her entertaining and informative talks would draw in hundreds of people. Because of these talks, in 1931, she became the first woman to become a full-time naturalist with the National Parks Service. She helped design the first trail to Old Faithful, and in her 7 years as a naturalist, she wrote over 20 articles and coauthored Plants of Yellowstone National Park with Walter B McDougal. She also advocated for better living conditions for Park empluees and their families. She argued that improved housing and more benefits would help recruit better-qualified staff.

Kathryn “Kitty” Hach-Darrow, 1922 – 2020

While not Iowa-born, Kitty did a lot of good work in Iowa. While attending Iowa State University, she met her husband, Clifford C. Hach, and they married in 1943. While working in a water treatment plant, Clifford had the idea for a simplified method of analysis that would allow workers to treat water with powdered formulas rather than the heavy chemical solutions they were using. In 1947, they co-founded the Hach Chemical Company based on this idea. They bought an acre of land in Ames, IA, to build their plant on. They also lived in an apartment on the plant with their 3 children.
As municipal standards for drinking water evolved, Kitty recognized the importance of water plant operators as a market and the need to work closely with them to provide long-term customer service. This drive for excellent service led to her creating a direct mail marketing campaign where she flew a plane with product directly to municipalities of all sizes. While operating this campaign, she flew over 7,000 hrs and became a part of the Ninety-Nines, an international group of women pilots.
In 1957, the Hachs won the American Water Works George Warren Fuller Award for distinguished service in the water supply field. In 1978, they moved their headquarters to Loveland, CO.
Kitty was known as an accomplished pilot and one of the top women business owners. She was also the first woman director of an international non-profit focused on better water quality, the American Water Works Association. Afterward she served on many AWWA committees, including the President’s Advisory Council.
These are only a handful of intelligent, caring, and passionate women who have helped shape today’s conservation. Without them and many others, we may not be where we are today. So thank you to the women of the past, who have paved the way for others. Without your struggle, roughly half of the population would not have the choice to be naturalists or conservationists.

The 2026 Impaired Waters List

Updated March 26
A draft of Iowa’s 2026 impaired waters list was released for public comments in March. In our comments, we raised some concerns about how data gets ignored or misinterpreted.
On St. Patrick’s Day, I gave a talk for the Izaak Walton League explaining why lakes and rivers turn green and how the assessment process works and why so many waters get stuck on the impaired list. Here is a recording.

Update on nitrate and drinking water
The last time the Iowa DNR submitted a list of impaired waters to the EPA, there was a dispute about six stretches of river that supply drinking water to Des Moines, Cedar Rapids, Iowa City, and Ottumwa, and used to supply water to Oskaloosa. The DNR claimed that the drinking water standard for nitrate should be evaluated using a 10% threshold, but even with this interpretation, two of the rivers failed to meet the standard this time. This chart shows what all the fuss is about.
The Goose Excuse Bill
Ioway Creek in Ames and West Indian Creek in Nevada have very high levels of E. coli, but aren’t on the impaired list because of a state law which limits how the DNR can use our data. They would have been joined on the Waters in Need of Further Investigation list by hundreds more rivers if the legislature passed House File 2530:
An Act requiring the Department of Natural Resources to identify specific animal sources of pollutants to a water of the state when determining the water’s inclusion on a list of impaired waters.
Thankfully, the bill did not make it through the second funnel. While it’s useful to know where bacteria is coming from, DNA testing is expensive and should be done after a problem has been identified.
Finding clean waters
I am sometimes asked where to go in Iowa to find clean water for paddling, swimming, floating in an inner tube, or just letting the kids splash and catch crayfish in the creek. A map or list of impaired waters is not very helpful for this, because the waters that aren’t included might be clean, or they might not have been assessed. So I made an interactive map, color-coded to show which lakes and rivers met or exceeded the primary and secondary contact recreation standards, in the last four recreational seasons.

The Fine Print
If you explore the Impaired Waters List and the rest of the assessment database, you will likely run across some things that don’t make sense. I share your frustration! This pair of short videos from our “Clean Water Act: 50 Years, 50 Facts” series contrasts how Section 305(b) and 303(d) of the Clean Water Act should work in theory, and how it can go wrong in practice. However, I continue to see improvements in the assessment database (ADBNet) and water quality database (AQuIA) and want to express my appreciation to IDNR for the data they collect and their efforts to be make it available to the public.

