Thirteen volunteers braved the cold on October 24 to test water quality in Squaw Creek, the South Skunk River, and their tributaries. For some, this was their 14th Fall Water Quality Snapshot. For others it was their first time doing stream monitoring. What we found defies easy categorization.
Update: The name “Squaw Creek” was officially changed to “Ioway Creek” in February of 2021, to be more respectful to native peoples. Over the next year, expect to see some changes to the names of the Squaw Creek Watershed Coalition and other groups that have formed to protect the creek, as well as maps and signs.
Volunteers Diane Birt, Paul Readhead, Liz Calhoun, and Rick Dietz take turns brushing off rocks to capture bugs in our net. The water was freezing!
By some indicators, water quality in Squaw Creek was good. Since I wasn’t sure how many creeks would be flowing when I planned this event, I added bug collection to the agenda to keep us busy. Excuse me. Benthic macroinvertebrate sampling. We were pleased to find tiny stoneflies and mayflies. They’re good fish food, ask any fly fisherman! Excuse me. An important part of the aquatic food web. These insects also act as a sort of canary in the coal mine. They need water with a lot of dissolved oxygen so will be rare or missing in streams with too much pollution, murky water, or not much in the way of habitat.
Fun fact: while the adult mayfly is notorious for living only 24 hours, the juvenile form (naiad) lives in the stream for several years. If you’re curious what adult mayflies and stoneflies look like, I found somephotos from our neighbors in Missouri.
By some indicators, water quality in Squaw Creek and it’s tributaries was bad. As in, there’s poop in the water. Excuse me, fecal indicator bacteria. This month, E. coli bacteria in Squaw Creek continued to exceed the primary contact recreation standard, and College Creek jumped above secondary contact standard. I wondered if this spike might be due to accumulated… debris… being washed out of the storm sewers and off the landscape by the 1.25 inch rain we received Thursday and Friday, but the lab samples were actually collected on Wednesday Oct 21, so I’m not sure. Anyway, covid-19 is not the only reason I bring hand sanitizer to these events!
By some indicators, water quality was unusually dry this fall. Nitrate was too low to detect at 13 of 16 sites we tested. Under wetter conditions, as we had this spring or last fall, nitrate in these same streams was higher and differences due to landuse or conservation practices in the watershed become more apparent.
Site
Watershed
Fall 2020
Spring 2020
Fall 2019
Squaw Creek @ Duff Ave
Rural and urban
0
10
5
Bluestem Creek @150th St
Rural
2
10
5
Glacial Creek @ U Ave
Rural (with a constructed wetland)
0
2
2
College Creek @ University
Urban
0
2
2
Nitrate-N concentrations, in mg/L
Water quality is rarely all good news or all bad news. Citizen science can us a more complete picture.
On any field in Iowa, cover crops will improve soil health, sequester carbon, and prevent nutrients from washing down to the Gulf of Mexico. There are at least six situations where cover crops can add to the farmer’s bottom line, but in other situations, or to help encourage farmers to make that initial investment and get through the troubleshooting stage that comes with any new practice, public cost sharing can make a difference. Most taxpayers I talk to are quite willing to pay farmers who are employing conservation practices for the ecosystem services they provide. But we either can’t afford to or aren’t willing to invest at the scale needed to achieve universal adoption of cover crops and other conservation practices, and that means we have to make some decision about where to invest first, so as to get the most nutrient reduction (and hopefully carbon sequestration, soil protection, flood reduction, and other benefits) for our buck.
Most of those discussions are way above my pay grade. I suppose the legislators who draft the federal farm bill and the NRCS bureaucracy set payment rates and application scoring criteria for EQIP and other cost share programs. Iowa’s Water Resource Coordinating Council picked priority watersheds that can get special funding.
Planning at the local level can also influence where conservation investments are made. However, it’s not always clear what influence a Watershed Management Authority actually has over where 1000 acres of cover crops gets planted, or why it’s better to plant them in one part of a county rather than another. Same goes for other conservation practices. Here are 5 possibilities.
1. Plant cover crops where they can protect a local lake or water supply
In addition to Gulf Hypoxia, phosphorus that washes off the land is causing algae blooms in many of Iowa’s lakes. Overnight, these algae blooms can use up the oxygen that fish and other aquatic critters need to breathe. Some kinds of cyanobacteria can produce toxins that can harm people and pets. Algae blooms are nuisance for those who would like to swim, fish, boat, or water-ski in those waters. We can address two problems at once if those 1000 acres of cover crops are planted in the watershed of Hickory Grove Lake, Saylorville Lake or other water bodies suffering from an excess of green.
In addition to Gulf Hypoxia, nitrogen that washes off Iowa farmland can cause a problem for cities that pull their water from a river, or from wells close to and influenced by a river. The Des Moines Waterworks and the Raccoon River watershed have rightly gotten a lot of attention, but other cities in other watersheds (like Boone, on the Des Moines River) also are dealing with high nitrate in their source water. Cover crops in the right watersheds can help protect those water supplies.
Nitrogen and phosphorus can also cause algae blooms in creeks and rivers, but the science is more complicated than in lakes, and not often done. For example, while the Squaw Creek Watershed Management Plan demonstrates that nitrogen and phosphorus levels in the creek are high, it does not make the case that meeting our nutrient reduction goals will protect drinking water, improve fisheries, make for safer recreation in Squaw Creek. Maybe that’s a safe assumption, but I honestly don’t know.
2. Plant cover crops where they can reduce the most nitrogen
Here’s a map of nitrogen load by HUC-12 watershed in Story County, based on landcover. This kind of model would be handy if you wanted to guess which stream has higher nitrate levels at its outlet. If I plant 1000 acres of cover crops south of McCallsburg (in the “Drainage Ditch 81” hydrologic unit) will I get more nitrogen reduction than if I plant them west of Ames (in the Squaw Creek-Worrell Creek hydrologic unit)? Nope. The pounds/acre estimate here is for the whole watershed, and it’s based purely on landcover in that watershed. Unlike the larger watershed, a field west of Ames wouldn’t be 20% developed, it’d be 100% agriculture, so with this model we can’t assume it’d be different than a field anywhere else in the county. More sophisticated computer models like SWAT or SPARROW incorporate things like soils, slope, and county-level fertilizer sales as well as landcover, but it’s hard to tell which of those things is driving the results.
Other models like the Nutrient Tracking Tool are field scale, and can be used for this kind of prioritization. Running through some quick scenarios, I estimated that cover crops on a tile-drained field in the Squaw Creek watershed could prevent 9 lbs/acre of nitrogen loss each year, versus 3 lbs/acre in an undrained field in the watershed. Computer models can be helpful, if we’re clear about their purpose and limitations.
3. Plant cover crops where they can reduce the most phosphorus and sediment
Cover crops have gotten more traction in hilly southern Iowa, where soil erosion is a more visible problem and no-till is common. From a standpoint of tons of soil erosion prevented, or pounds of phosphorus loss avoided, it makes sense to plant on fields with steep slopes and erodible soils. Models like RUSLE can be helpful for this.
4. Plant cover crops where their water quality benefits can best be measured
1000 acres of cover crops will make a bigger splash in a small watershed than in a big one. A small change in water quality is difficult to detect. Just like a poll that talks to a small number of people has a margin of error, a water testing program that samples only 12 or 24 days out of the year will have some uncertainty attached to the results. I’ll be talking more about “minimum detectable change” in future posts, but suffice to say that margin of error is usually closer to 10 or 20 percent than 1 or 2 percent. That means we need to give some thought to where conservation practices will be located relative to long-term water monitoring sites if we hope to document their effects with water monitoring.
Location of monitoring sites in Story County, and agency monitoring
Row-cropped acres in watershed
Expected N and P reduction at monitoring station from 1000 acres of cover crops in watershed
5. Plant cover crops where it is most cost-effective for the producer
We do some of this unintentionally. A farmer who can figure out how cover crops will make financial sense for their operation–cutting a pass for weed control or loosening compaction, providing forage for cattle, or protecting yields in wet or dry years–is more likely to sign up when the cost share being offered is $25-$35/acre. Those that think they will lose money will pass until we offer better incentives–for example, Maryland was paying up to $90/acre and has gotten more takers.
This is also the idea behind “precision conservation” promoted by Land O’Lakes and other retailers. With precision yield monitoring, conservation practices like wetlands, prairie strips, or buffers can be placed so as to minimize lost revenue. Poorly draining or steep parts of a field might actually cost more to plant, till, and fertilize than it generates in revenue, so farmers could install conservation practices and even come out ahead.
That’s 5 ways to get more conservation bang for our buck. Let’s be more clear about which of these we’re hoping to achieve when we do watershed planning, and more creative about how we support good stewardship.
Does this make sense? Are there other ways to be more cost-effective with conservation? Leave a comment!
It turns out that stream monitoring is quite compatible with social distancing. 28 volunteers participated in the Squaw Creek Watershed Coalition’s 13th spring water quality snapshot on May 30 and 31. Together we tested water quality at 43 sites on Squaw Creek, its tributaries, and the South Skunk River! This time, Prairie Rivers of Iowa assembled the equipment, organized the event, and entered the data. We’re happy to support this dedicated group of citizen scientists in better understanding and drawing attention to our local rivers and creeks.
Update: The name “Squaw Creek” was officially changed to “Ioway Creek” in February of 2021, to be more respectful to native peoples. Over the next year, expect to see some changes to the name of the Coalition, as well as maps and signs.
Here’s a few selfies taken by participants, a mix of long-term volunteers and new faces.
The Kopecky family by the South Skunk River
Jeff White at Gilbert Creek
Kelly Nascimento Thompson at Glacial Creek
Kurt Plagge and Mary Burnet at Onion Creek
As the name implies, this is a snapshot in time. The water quality on one sunny weekend in May is not necessarily representative of the month, let alone the year. As described here and here, water quality can change dramatically in response to a big rainstorm. But for this moment in time, testing many sites gives us a very detailed picture of the Squaw Creek watershed.
For example, during May 30 and 31, nitrate in Squaw Creek at Moore Park and other locations in Ames was quite high (11-12 mg/L) exceeding the drinking water standard (10 mg/L). Where is that nitrate coming from? All over its 147,000 acre watershed, but in some tributaries more than others, as you can see in the color-coded chart below. Nitrate was especially high in the upper reaches of Squaw Creek, Gilbert Creek and Clear Creek and especially low in Glacial Creek (which has a series of constructed wetlands and a lot of pasture) and College Creek (which has an urban watershed). The upstream, rural parts of College Creek and Clear Creek have higher nitrate, which appears to be diluted they move through town.
For phosphorus some of the patterns are flipped. Glacial Creek has especially high orthophosphate (the dissolved form of phosphorus) while Clear Creek is especially low.
There’s lots of interesting patterns to explore, and more data from this and previous snapshot events here. If you’re curious about water quality, subscribe to our blog, I’ll be continuing to interpret data from this and other sources.
Thanks to all our volunteers for collecting it!
Questions about stream monitoring, or observations from our volunteers? Post a comment.
Last weekend’s rains (5-17-2020) provide a clear illustration of how water and nitrate make their way to Squaw Creek.
Squaw Creek at Brookside Park
How water reaches Squaw Creek after a rain
It started raining late Saturday night and stopped around 3AM Sunday. The rain gage outside my house in Ames showed 0.9 inches. The water hitting my driveway and other paved surfaces in my neighborhood enters a storm sewer that goes directly to a tributary of Squaw Creek. (In newer neighborhoods, the water would be slowed down by a pond or detention basin). This runoff takes about an hour to make its way down Squaw Creek to the USGS stream gage at Lincoln Way. In response to urban runoff and the rain that fell directly on the channel, we can see a quick rise in the water level, and quick fall.
Over the next 15 hours, Squaw Creek rose another foot as it was joined by water that fell as far away as Stratford and Stanhope. Other than urban areas, we probably didn’t see much runoff from the storm, which was relatively gentle and fell on soils that weren’t particularly steep or waterlogged. The fall in water level Sunday afternoon and Monday was more gradual, reflecting the release of water from drain tiles and groundwater.
Figure adapted from University of Michigan Extension
How nitrate reaches Squaw Creek after a rain
It’s well-known that tiles and ditches provide a direct pathway for nitrogen to leak out of the soil in corn and soybean fields. Think of cover crops as a way to plug the leak, and bioreactors, saturated buffers, and wetlands as a bucket placed underneath. You can watch the leak from last weeks’ storm with IIHR’s nitrate sensors. This graph is from a sensor installed in Squaw Creek in Moore Park, where it enters Ames. (The colors are the reverse of what you’d expect–brown is streamflow, blue is nitrate).
The nitrate concentration in Squaw Creek fell from 5 to 4 mg/L overnight, diluted by direct precipitation and urban runoff, and then rose to 14 mg/L as water from drainage tiles made its way downstream. As tile flow tapers off, nitrate concentrations gradually fall toward the lower levels seen in groundwater.
Nitrate drops as you move downstream
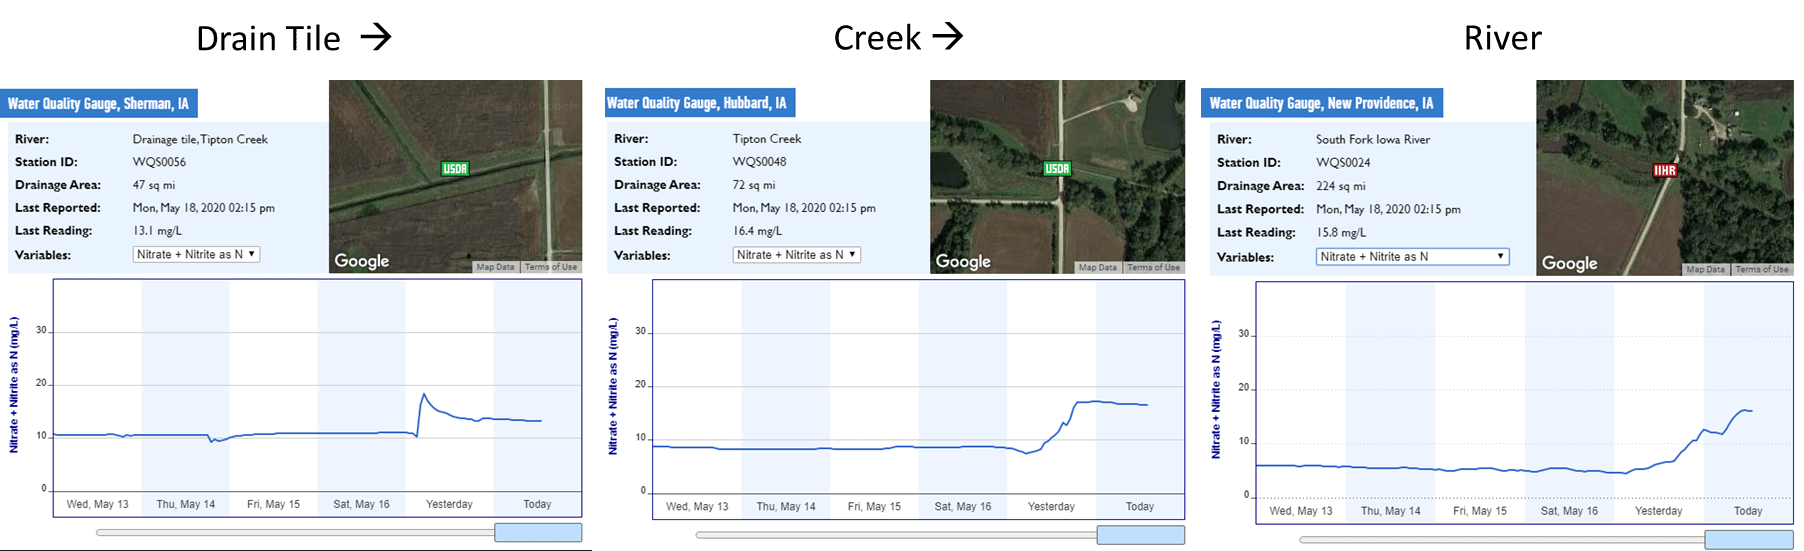
In Hardin County, there’s a nice set of three sensors that clearly showed what happens as water moves downstream during this storm. Not every stream demonstrates this behavior, but many do.
At the tile outlet, nitrate levels are highest to begin with (10.9 mg/L) and show the sharpest increase, spiking to 18.3 mg/L by 5AM after some initial dilution. Since the water takes some time to reach the next downstream sensor, Tipton Creek near Hubbard, the peak doesn’t happen until 8 PM, rising from 8.6 mg/L to 17.1 mg/L. Further downstream in the South Fork of the Iowa River, near New Providence, water is reaching the sensor from several tributaries, smoothing out some of the changes. Nitrate rises from 4.5 mg/L Saturday night to a peak of 16.2 on Monday morning at 11:00.
There are several reasons why nitrate tends to decline as you move downstream. First, tile systems drain mostly agricultural land, while a larger stream will also drain some field margins, pasture, and woodland. Second, nitrate is removed from the water by algae, plants, and microbes. Waterlogged organic matter, whether in a low spot in a field, a wetland, a stream bottom, or a woodchip bioreactor, is good habitat for denitrifying bacteria. Third, many Iowa streams flow from northern Iowa southeast to the Mississippi River, or southwest to the Missouri River, and as you get into southern Iowa, the land becomes hillier, tile drainage becomes less frequent, and pasture more common.
Tile drained fields lose a lot of nitrogen in spring. That’s not news to anyone, but hopefully this helps you visualize and understand the process.
Update, 5/29/2020: We had even bigger rains the following week, but spread over several days, so the pattern was less clear. We’re still seeing nitrate concentrations >10 mg/L in the rivers, and >15 mg/L at tile outlets.
We’re all a bit stir-crazy and can benefit from spring weather and spring flowers. If you’re in Ames, I recommend walking east of the ISU campus, where (as of April 5) the ground is carpeted with blue flowered squills, Scilla siberica. It’s not often that you see that color blue in nature, or in that quantity!
While you’re there, take a peek in College Creek. When I visited, the water was clear, the bottom was rocky, and it was full of 4-6 inch fish.
This was great to see. College Creek used to be a dump, but between legal action against businesses and mobile home parks that were discharging sewage,urban conservation projects, and the annual trash clean-up event, it’s become a lovely place. Most of our backyard streams have the same potential, if we treat them right.
I should caution you that that E. coli levels in College Creek and other streams in Ames often exceed the primary contact recreation standard, but you’re washing your hands constantly anyway, right? (Bold values in the table below exceed the single-sample maximum of 235 colonies/100mL. Data are collected and posted by the City of Ames.)
Prairie Rivers of Iowa kicked off 2020 with watershed education for both the young and old. Over four sessions in January and February, watershed educator Dan Haug spoke with 20 retirees for an Osher Institute for Lifelong Learning (OLLI) class at the Iowa State University Alumni Center. In addition to unpacking difficult topics like the Clean Water Act and water monitoring, Dan introduced the class to online resources he uses to find out about water quality in local rivers and lakes, and about landuse and soils in their watersheds. The class brought back examples and asked questions about rivers, lakes, and drinking water in their home towns and vacation spots, giving us all a better picture of water quality issues and solutions around the state. On February 7-9, high school students from Iowa, Minnesota, Illinois, Missouri, Minnesota, and Oklahoma attended a training on the ISU campus for the 4-H Ag Innovators Experience, sponsored by Bayer and the national 4-H council. By training teenage facilitators to lead activities at their 4-H clubs, schools, or community events, the program has helped over 5000 youth learn about monarch butterflies and native bees in previous years. This year, the focus is on ecosystem services, water quality, nitrogen, and engineered conservation practices. The youth will be learning about bioreactors, saturated buffers, bioswales, and rain gardens. Watershed Educator Dan Haug helped the planning team at ISU Extension create a hands-on activity to show how rain gardens can soak up runoff, as well as creating maps that the youth will use for a simulated watershed planning exercise. At the training, Dan shared his experience working with real-life watershed management authorities and worked with the teen leaders in the computer lab to track down information on their own watersheds. This is a far-reaching project with input from a great group of educators and water experts. We were happy to be a part of it! Contact us if you have an idea that could become our next educational event or project!
Thank you to the board members who brought in donuts and coworkers who brought home-baked desserts to the office in 2019. As a result, my New Year’s resolution is to lose weight and eat healthier!
Kidding aside, Prairie Rivers of Iowa is an organization with a long track record of supporting local food systems. Local food is a much better framework for healthy eating than picking processed foods based on high-this or low-that claims on the box. Whole foods—vegetables from the farmers market or CSA, eggs from my backyard chickens, fruit from U-pick orchards—are not just nutritious but a source of joy in the harvesting, purchasing, and cooking. “Eat more locally grown fruits and vegetables in 2020” is a pledge that makes me look forward to the coming year rather than dreading it.
But I’m not overweight and in pain because I don’t eat fruits and veg. Like most members of my extended family, I have chronic health conditions that are exacerbated by sugar, saturated fat, and refined carbohydrates. Like most Americans, I eat a diet high in those things because of they are socially encouraged (how many times have you accepted cookies to be polite) or cheap, convenient, and well-advertised. With half a pig in the freezer (raised by Tom and Carman Rosburg), I asked my doctor for dietary recommendations that did not involve giving up ham and got a very sensible response—cut back the red meat to one or two meals a week. A similar strategy can apply to sweets, white rice, potatoes, and baked goods made without whole-grain flours.
I’ve had one week of planning for moderation and succeeding, after a previous week of planning for abstinence and failing. I can already see how that shift in perspective could be more sustainable—both in the sense of “being able to keep it up past February” and in the sense of “preserving soil, water, and biodiversity.”
When I budget my pastry intake for the week, it becomes imperative to choose something I really like, rather than something convenient like store-bought donuts, muffins, or cookies. That has benefits for the environment, as these foods are often made with palm oil, usually produced by cutting down rain forests.
If full fat cheese and red meat are viewed as an indulgence rather than a staple, I can afford to buy premium products directly from local farmers that are employing the most sustainable practices –for example, Lost Lake Farm near Jewell makes delicious hard cheeses with a rotational grazing system that builds soil organic matter.
Currently, 36% of the US corn crop goes to feed livestock, which converts about 20% of that energy into food calories. 40% of the corn crop goes to ethanol and much of the rest goes into processed foods and sweeteners. This is not an efficient way to feed the world. Prairie Rivers of Iowa has worked with corn, soybean, and livestock producers of all sizes who are making changes to protect soil and water, but widespread adoption of cover crops, perennials and extended rotations has been limited by a lack of local markets and processing for additional crops. If consumers ate less meat and processed foods and more whole grains, and Midwestern farmers shifted some acres out of corn*, it would have undeniable benefits for public health, climate, soil, and water.
*We could shift away from sugar beets, which produce even less nutrition per acre than corn and have their own environmental impacts. You’re not getting off so easy, North Dakota and Minnesota!
The Iowa Department of Natural Resources is seeking public comment on the newly released draft impaired waters list. Prairie Rivers of Iowa will be recommending that Squaw Creek and East Indian Creek be added to “Waters in Need of Further Investigation.” We’ll also take this opportunity to try to demystify a topic that can be confusing, using examples from the South Skunk River watershed.
Every two years, the DNR is required to assess the available data to determine whether Iowa’s lakes, rivers, and wetlands are meeting their designated uses. About half the rivers, and a bit more of the lakes have enough data to assess. Since new waters are considered each cycle, the length of the impaired waters list doesn’t really tell us whether water quality is getting worse. Since nutrients aren’t considered for most uses and the data used for the 2018 assessment is from 2014-2016, it doesn’t tell us whether the Iowa Nutrient Reduction Strategy is working. What it tells us is the extent and severity of local water quality problems that have been officially vetted.
Recreational Uses
A river segment, lake, or reservoir that gets use by paddlers or where children play would be designated A1 (primary contact recreation use) or A3 (children’s recreational use). To determine whether the water quality is good enough to support these uses, the DNR compares E. coli bacteria to the state standard (a geometric mean of 126 organisms per 100mL). If the stream consistently exceeds the standard, that means there could be enough human or animal waste in the water to pose a health risk to anyone that swallowed some–a child splashing in the creek, or a paddler who tipped their canoe might get exposed to a waterborne illness.
Fully supporting: None of the lakes or rivers in our watershed appeared on this list
Partially supporting: The South Skunk River above Ames was slightly impaired with high E. coli levels in one of three years. Indian Creek near Maxwell, the upper part of Long Dick Creek in Hamilton County, Montgomery Creek in Boone County, Hickory Grove Lake in Story County, Lake Keomah and White Oak Lake in Mahaska County all have moderate E. coli problems.
Not supporting:Prairie Creek in Boone County has consistently high E. coli levels. The data was collected through an agreement between Iowa DNR and volunteers with the Squaw Creek Watershed Coalition.
Not assessed: This includes Squaw Creek, East Indian Creek, McFarland Pond, and many others.
Wait a minute, Squaw Creek and East Indian Creek? Didn’t we work with City of Ames and Story County Conservation to collect three years of monthly E. coli samples, starting during the assessment period? Wasn’t the 2016 geometric mean ten times higher than the standard? Yes, but DNR never approved a quality assurance plan, so under Iowa’s Credible Data Law, they can’t use our data. However, we will write to DNR to recommend that they add those streams to Iowa’s list of waters in need of further investigation (WINOFI). We’re aware that bacteria cleanup plans for large rivers are difficult to do and are a low priority for the department, but we want people to be more aware of the health risks.
Aquatic Life Uses
The South Skunk River is a warm water stream with a smallmouth bass fishery, so is designated B(WW-1). Most of its perennial tributaries don’t have enough water or habitat for gamefish so are designated* B(WW-2) for other aquatic life. Fish kill reports, biological monitoring of fish and invertebrates, and monitoring of dissolved oxygen and some toxic chemicals are used to assess whether water quality is good enough to support these uses.
*Adding to the confusion, smaller creeks are given a presumptive A1 B(WW-1) designation until a Use Attainability Assessment proves otherwise. This change supposedly gives them extra protection, but I don’t see how that would work in practice.
Waters in Need of Further Investigation:Onion Creek, Worrell Creek, and College Creek had some low scores for fish or invertebrates, but DNR hasn’t worked out an appropriate threshold for these headwater creeks. The lower part of Ballard Creek was removed from the impaired waters list and placed in this category when DNR discovered an error in the previous assessment.
Not Assessed: This includes several segments of the South Skunk River, Dye Creek, Clear Creek, Keigley Branch, West Indian Creek and many others.
Takeway message:
If a river was added to the impaired waters list, don’t assume it’s gotten dirtier. Maybe it was always polluted and we hadn’t bothered to look. And by the same token, if a river is not on the impaired waters list, don’t assume it’s clean.
Nitrogen rate management (MRTN) is the low-hanging fruit of the Iowa Nutrient Reduction Strategy, a win-win for profitability and the environment. On closer inspection, that fruit is even juicier than we thought; but harder to reach.
Here’s the paradox of nutrient management that the general public fails to grasp. We don’t know with any certainty at application time how much nitrogen the corn crop will need or how much nitrogen will be left in the soil come July when the crop starts maturing. Corn stalk nitrogen tests and split applications can improve the accuracy of the guess, but farmers still have to guess. If they guess too low, they lose income. So most farmers err on the high side, which means that (all else being equal) more nitrogen will end up in our streams.
We may not know what’s the right amount of nitrogen to apply this year, but we can pinpoint a range that makes the most economic sense across sites and years. In 2005, Iowa State University researchers crunched the numbers and developed an online calculator. A farmer can enter current prices for corn and fertilizer to get the Maximum Return To Nitrogen (MRTN). Above that range, they might get a bit higher yield, but the revenue from those extra bushels doesn’t offset the cost of the extra nitrogen. Applying nitrogen at the MRTN is a rare win-win for profitability and the environment.
Along with cover crops, wetlands, and bioreactors, MRTN was one of the more promising practices for nitrogen outlined in the Iowa Nutrient Reduction Strategy. Still, the authors cautioned that it wouldn’t get us very far by itself. An average field would cut nitrate losses by 10 percent. Since some parts of the state apply less nitrogen than others, universal adoption of this practice would get us a 9 percent reduction in nitrate concentrations.
That modest reduction assumes Iowa farmers currently apply 150 lbs of N/acre on a corn-bean rotation and 190 lbs/acre on continuous corn, a figure the authors admitted were “possibly outdated.” A 2017 survey by ag retailers found that Iowa farmers apply 169 lbs/acre of nitrogen on corn after beans and apply 210 lbs N/acre on continuous corn. I updated Dr. Helmers graph with those numbers and an MRTN based on current corn and nitrogen prices to determine the potential water quality benefit. This low-hanging fruit is juicier than we thought!
And that’s just the average! Inspired by a recent essay by Chris Jones, I read a manure management plan for a field in one of our watersheds. It receives 190 lbs/acre of nitrogen and 146 lbs/acre of phosphorus in the form of liquid swine manure. If that manure could be spread over more acres at a rate of 140 lbs/acre, that could reduce nitrate losses by 31%. If it replaces rather than supplements commercial fertilizer, we could get another 4% cut in nitrate. Manure is a slow-release fertilizer and less susceptible to leaching.
Is that economical? Hard to say. Daniel Anderson reports that liquid swine manure can be moved seven miles and still be cheaper than synthetic fertilizer. In Story and Boone County that might work. Hamilton County has 218 manure management plans, so I’m not sure how far you’d need to travel to find a field not already being treated. Are there changes in processing or additional cost share that would help make it more feasible? I don’t know. No-one is talking about it. But cover crops work equally well. Winter rye grows thicker with fall-applied manure and can scavenge nitrogen that would otherwise be lost.
Unfortunately, neither of those options (MRTN or cover crops) are even suggested as part of manure management plans and the loudest voices in the room are saying livestock producers don’t need to be doing anything differently. Until that situation changes, the widespread adoption of rate management that’s assumed in statewide and watershed-based scenarios won’t happen and we will fail to meet our nutrient reduction goals.
GIS mapping is a big part of my job, but I’ll be the first to admit there’s a limit to what you can learn about a stream without getting your feet wet, or at least dipping a bucket into the water.
I’ve been testing West Indian Creek and Grant Creek at the lovely Jennett Heritage Area, just above their confluence. (With some help from David Stein and Rick Dietz) West Indian Creek flows through Nevada and drains 28,417 acres at this point. Grant Creek, also known as Drainage Ditch 5, drains 13,344 acres between Ames and Nevada.
Based on soils and landcover in the watershed, I’d expect Grant Creek to have comparable or slightly worse water quality than West Indian Creek. There are nutrient loading models available online and in the Story County Watershed Assessment that predict just that.
Instead, I’ve found that water quality is consistently better in Grant Creek. West Indian Creek has normal nitrate levels but very high phosphorus levels. At this point, I don’t know why.
Orthophosphate (mg/L)
Grant Creek
W. Indian Creek
5/14/2019
0
0.6
6/11/2019
0.1
1.0
7/25/2019
0
3.0
9/10/2019 (after rain)
0.6
4.0
Nitrate (mg/L)
Grant Creek
W. Indian Creek
5/14/2019
2
5
6/11/2019
2
5
7/25/2019
2
5
9/10/2019 (after rain)
0
0
I do know there are people in the West Indian Creek watershed working to improve water quality, both on private land and public land. If you own land or farm in the watershed and are thinking about doing more to conserve soil and water, contact our Watershed Coordinator, David Stein, to set up a free consultation.
If you live near Nevada and are want to help solve the mystery of these two creeks through water testing, contact Dan Haug. Prairie Rivers of Iowa is working with Story County Conservation and the Izaak Walton League to plan for and support volunteer stream monitoring around Story County in 2020.
A final note: Don’t judge a stream by its name, or lack of a name. The lower part of Drainage Ditch 5 is a natural creek with buffer vegetation, fish, clean water, and public access. The map below shows a pre-settlement land survey superimposed over a current topographic map. Interestingly, West Indian Creek was forested while Grant Creek was prairie. Thanks to the restoration efforts of Cindy Hildebrand and Roger Maddux, parts of Grant Creek are prairie once again.