Disclaimer: This article is not about politics. PRI is a non-partisan organization and does not want to get drawn into a discussion about the election. My intent here is to use an example that’s fresh in our minds to illustrate a challenge for progress tracking in water quality.
Polls are not always accurate. If you didn’t know that before November of 2020, you do now.
There are plenty of parallels with water, so if you’re looking to water quality monitoring to tell you whether or not conservation efforts in your watershed or your state are succeeding, read on.
Bottom line: Short-term water quality trends are usually too close to call.
Quinnipiac University can’t talk to every eligible voter in Florida, so they surveyed 1,657 people the week before the election.
Similarly, it’s not practical to test water quality in a stream 365 days a year, so we often make do with just 12 days a year. There are sensors that can test nitrate or turbidity continuously during the ice-free months, but they’re not cheap.
The voting patterns of those 1,657 people won’t be perfectly representative of Florida. How close do they expect to be? Based on the sample size, Quinnipiac calculates a margin of error: in this case 2.4 percentage points. Talking to more people would reduce the margin of error, but not enough to be worth the cost. In this case, Biden’s lead appears to be outside the margin of error.
Support for candidate
Point estimate
95% confidence interval
Biden
47%
44.6% to 49.4%
Trump
42%
39.6% to 44.4%
Similarly, the 12 days we test water quality won’t be perfectly representative of the year. How close can we expect to be? We can calculate a margin of error (here, the 95% confidence interval) around our water quality average. Did phosphorus decline in 2019? Too close to call!
Phosphorus in South Skunk River
Point estimate
95% confidence interval
2019 average
0.30 mg/L
0.20 mg/L to 0.40 mg/L
2018 average
0.36 mg/L
0.26 mg/L to 0.46 mg/L
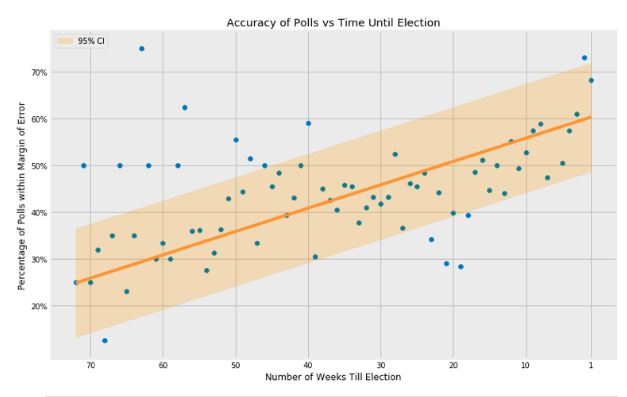
Oops! This poll missed the mark, and by more than the margin of error. Trump actually won Florida with 51.2 percent of the vote. Well, some errors are unavoidable. If sampling error were completely random, we’d expect about 5% of polls to miss by more than the margin of error. That’s what “95% confidence” means. However, according to a new study of 1,400 polls from presidential primaries and general elections, 40% of polls conducted a week before the election missed the mark by that much.
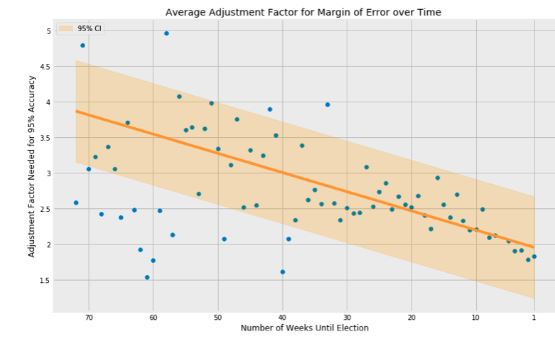
That’s because sampling error isn’t all random. People who ultimately voted one way may have been less likely to appear on the list of phone numbers, less willing to respond, less likely to say what they truly intended, or were more likely to have changed their mind in the final week. And then there’s undecided voters, who don’t always split evenly between candidates. Any of these things can skew the results. Pollsters try to correct for some of these things by weighting various demographic groups, but it doesn’t always work. For “margin of error” to mean what we think it means, according to Kotak and Moore, it would need to be at least two times wider.
Similarly, if monthly samples are not collected on a fixed day of the month, you might underestimate phosphorus or sediment load by planning your week to avoid getting wet, and over-estimate it by going out of your way to capture a sample during a storm. This challenge is well understood in environmental science and there are sampling strategies and equipment to get around it.
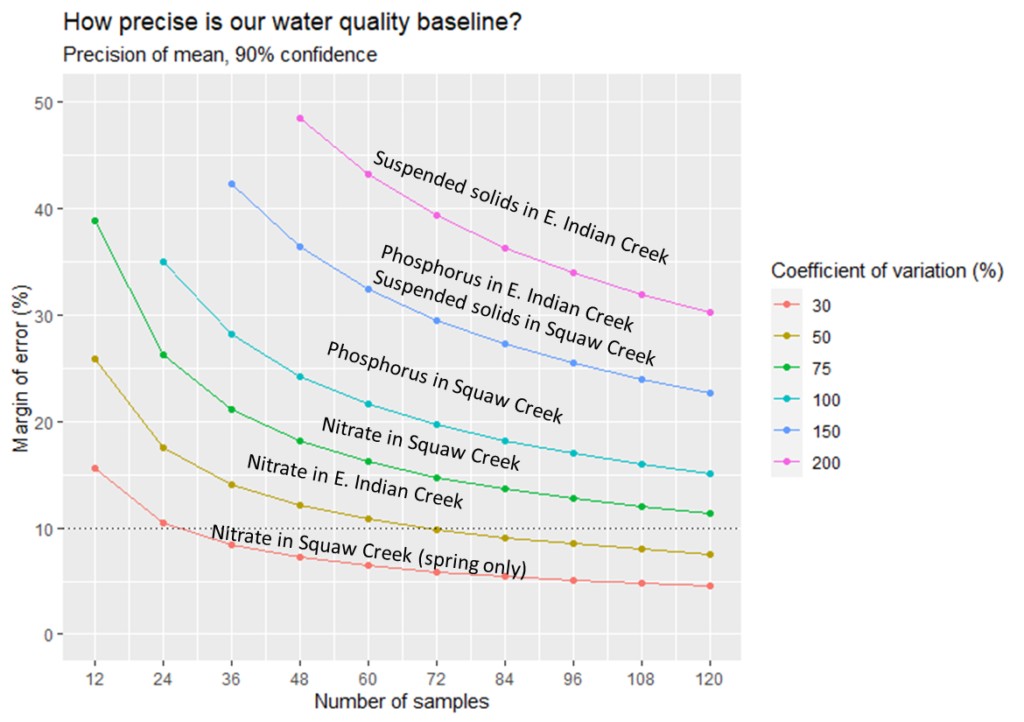
What’s not widely appreciated is just how big purely random sampling errors can be. I’ve read the literature and run my own numbers. Even with a 3 years of sampling, you’re lucky to get below a 20 percent margin of error. The problem is more severe for phosphorus and sediment (which move with runoff and vary a lot within a month) than nitrate (which moves with groundwater and drainage water, and is less variable).
Knowing this can help us set realistic expectations. As much as we’d like to know whether conservation efforts on the land are translating into improvements in water quality in the river, we’re not going to be able to tell the difference between a modest improvement and no improvement unless we sample often enough or long enough to bring down the margin of error. Figuring out whether this is worth doing, how to sustain it, and what other things we can learn from water monitoring has been the task of PRI and our partners around Story County working on a ten-year monitoring plan.
A final note. Have some sympathy for pollsters and scientists who are doing their best to base their findings on data, acknowledge the uncertainty in their conclusions, and strive to be less wrong. There are plenty of people on both sides of the aisle who confidently make predictions based on anecdotes, are wrong more often than not, and never admit it. 😉
Thirteen volunteers braved the cold on October 24 to test water quality in Squaw Creek, the South Skunk River, and their tributaries. For some, this was their 14th Fall Water Quality Snapshot. For others it was their first time doing stream monitoring. What we found defies easy categorization.
Update: The name “Squaw Creek” was officially changed to “Ioway Creek” in February of 2021, to be more respectful to native peoples. Over the next year, expect to see some changes to the names of the Squaw Creek Watershed Coalition and other groups that have formed to protect the creek, as well as maps and signs.
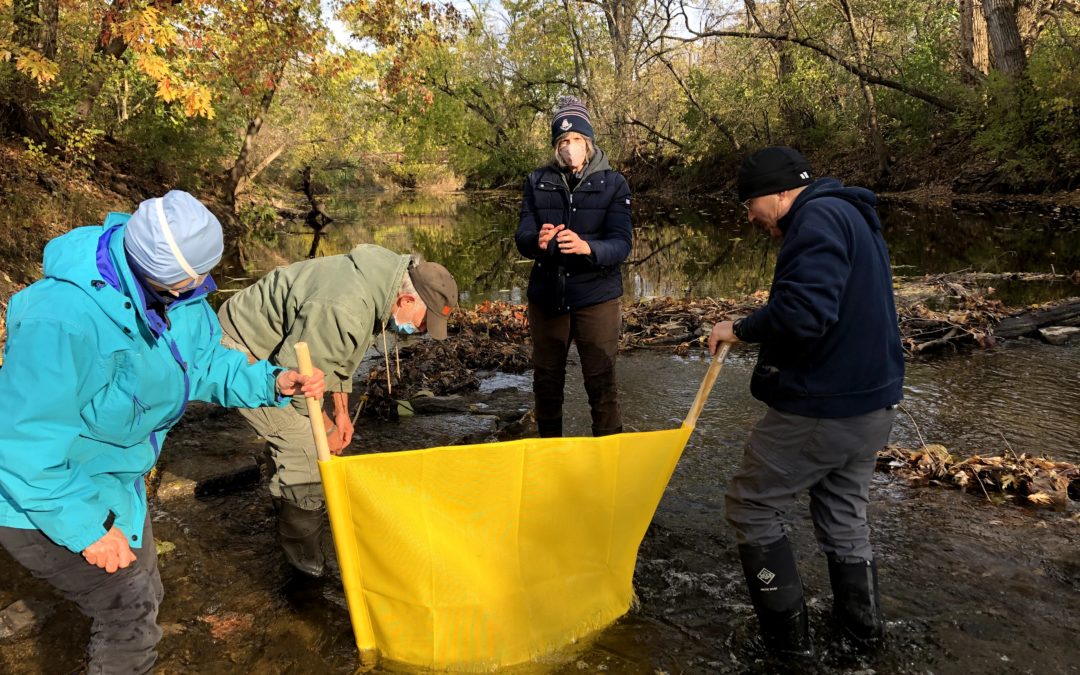
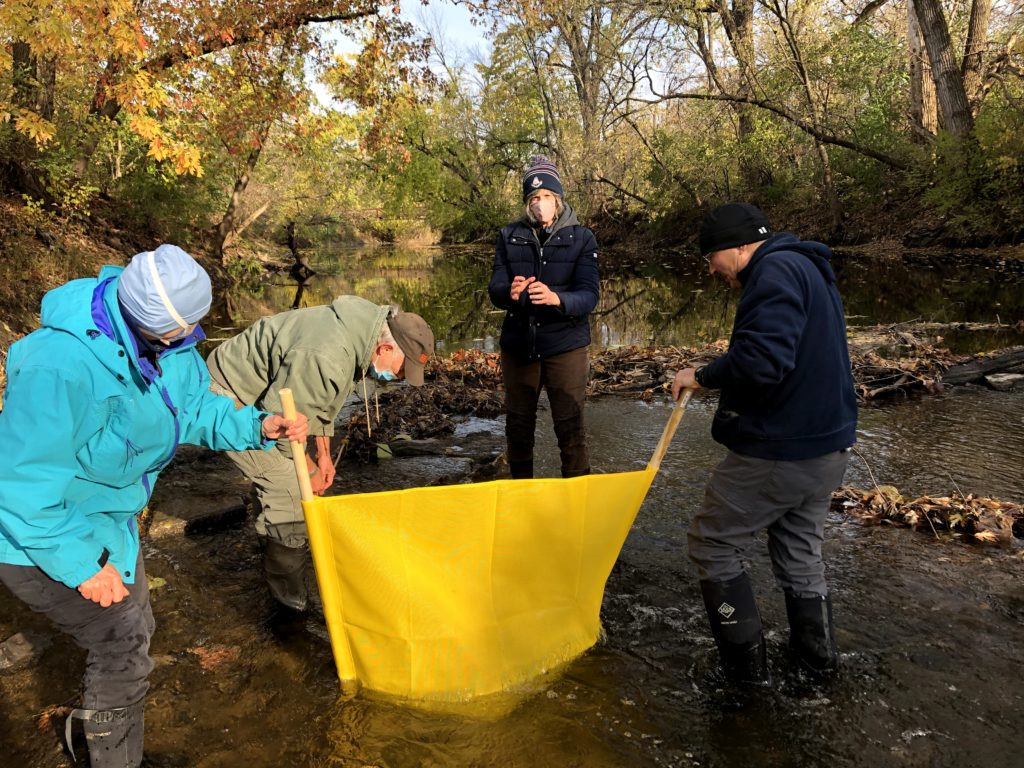
Volunteers Diane Birt, Paul Readhead, Liz Calhoun, and Rick Dietz take turns brushing off rocks to capture bugs in our net. The water was freezing!
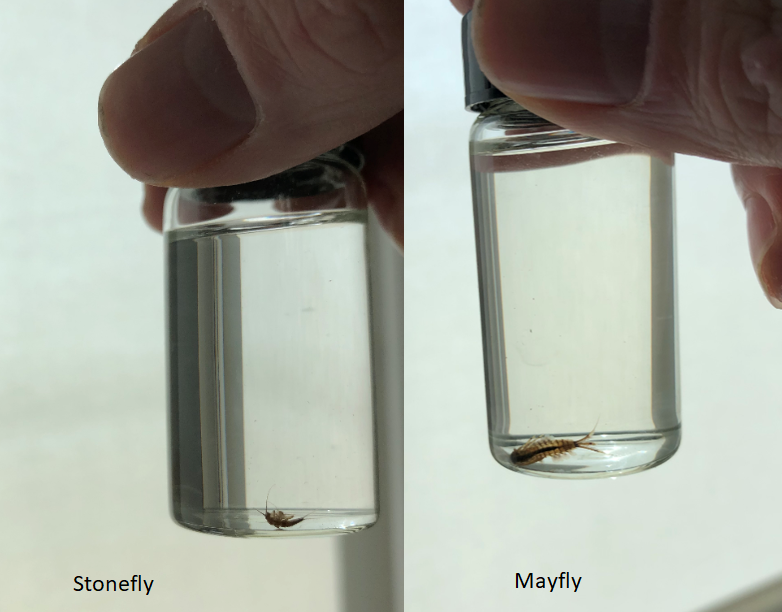
By some indicators, water quality in Squaw Creek was good. Since I wasn’t sure how many creeks would be flowing when I planned this event, I added bug collection to the agenda to keep us busy. Excuse me. Benthic macroinvertebrate sampling. We were pleased to find tiny stoneflies and mayflies. They’re good fish food, ask any fly fisherman! Excuse me. An important part of the aquatic food web. These insects also act as a sort of canary in the coal mine. They need water with a lot of dissolved oxygen so will be rare or missing in streams with too much pollution, murky water, or not much in the way of habitat.
Fun fact: while the adult mayfly is notorious for living only 24 hours, the juvenile form (naiad) lives in the stream for several years. If you’re curious what adult mayflies and stoneflies look like, I found somephotos from our neighbors in Missouri.
By some indicators, water quality in Squaw Creek and it’s tributaries was bad. As in, there’s poop in the water. Excuse me, fecal indicator bacteria. This month, E. coli bacteria in Squaw Creek continued to exceed the primary contact recreation standard, and College Creek jumped above secondary contact standard. I wondered if this spike might be due to accumulated… debris… being washed out of the storm sewers and off the landscape by the 1.25 inch rain we received Thursday and Friday, but the lab samples were actually collected on Wednesday Oct 21, so I’m not sure. Anyway, covid-19 is not the only reason I bring hand sanitizer to these events!
By some indicators, water quality was unusually dry this fall. Nitrate was too low to detect at 13 of 16 sites we tested. Under wetter conditions, as we had this spring or last fall, nitrate in these same streams was higher and differences due to landuse or conservation practices in the watershed become more apparent.
Site
Watershed
Fall 2020
Spring 2020
Fall 2019
Squaw Creek @ Duff Ave
Rural and urban
0
10
5
Bluestem Creek @150th St
Rural
2
10
5
Glacial Creek @ U Ave
Rural (with a constructed wetland)
0
2
2
College Creek @ University
Urban
0
2
2
Nitrate-N concentrations, in mg/L
Water quality is rarely all good news or all bad news. Citizen science can us a more complete picture.
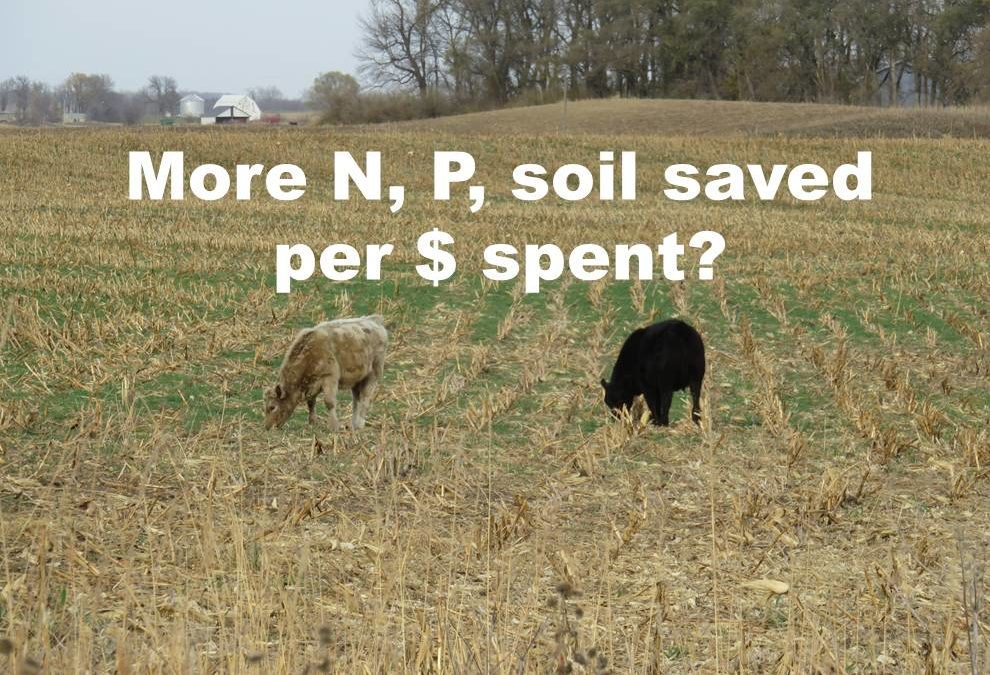
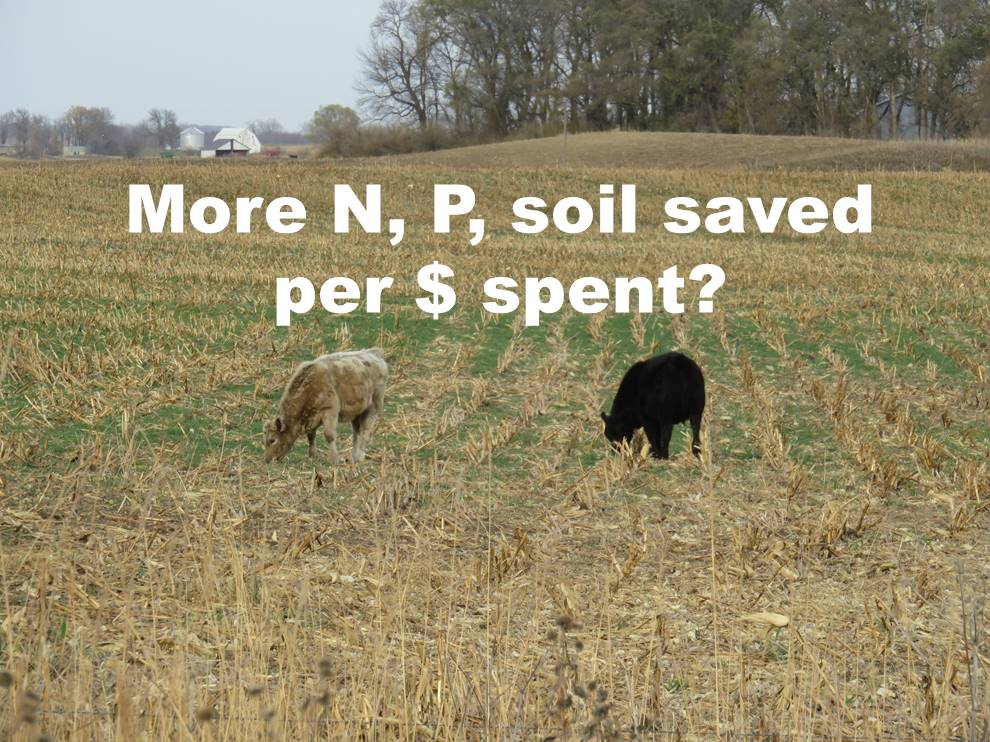
On any field in Iowa, cover crops will improve soil health, sequester carbon, and prevent nutrients from washing down to the Gulf of Mexico. There are at least six situations where cover crops can add to the farmer’s bottom line, but in other situations, or to help encourage farmers to make that initial investment and get through the troubleshooting stage that comes with any new practice, public cost sharing can make a difference. Most taxpayers I talk to are quite willing to pay farmers who are employing conservation practices for the ecosystem services they provide. But we either can’t afford to or aren’t willing to invest at the scale needed to achieve universal adoption of cover crops and other conservation practices, and that means we have to make some decision about where to invest first, so as to get the most nutrient reduction (and hopefully carbon sequestration, soil protection, flood reduction, and other benefits) for our buck.
Most of those discussions are way above my pay grade. I suppose the legislators who draft the federal farm bill and the NRCS bureaucracy set payment rates and application scoring criteria for EQIP and other cost share programs. Iowa’s Water Resource Coordinating Council picked priority watersheds that can get special funding.
Planning at the local level can also influence where conservation investments are made. However, it’s not always clear what influence a Watershed Management Authority actually has over where 1000 acres of cover crops gets planted, or why it’s better to plant them in one part of a county rather than another. Same goes for other conservation practices. Here are 5 possibilities.
1. Plant cover crops where they can protect a local lake or water supply
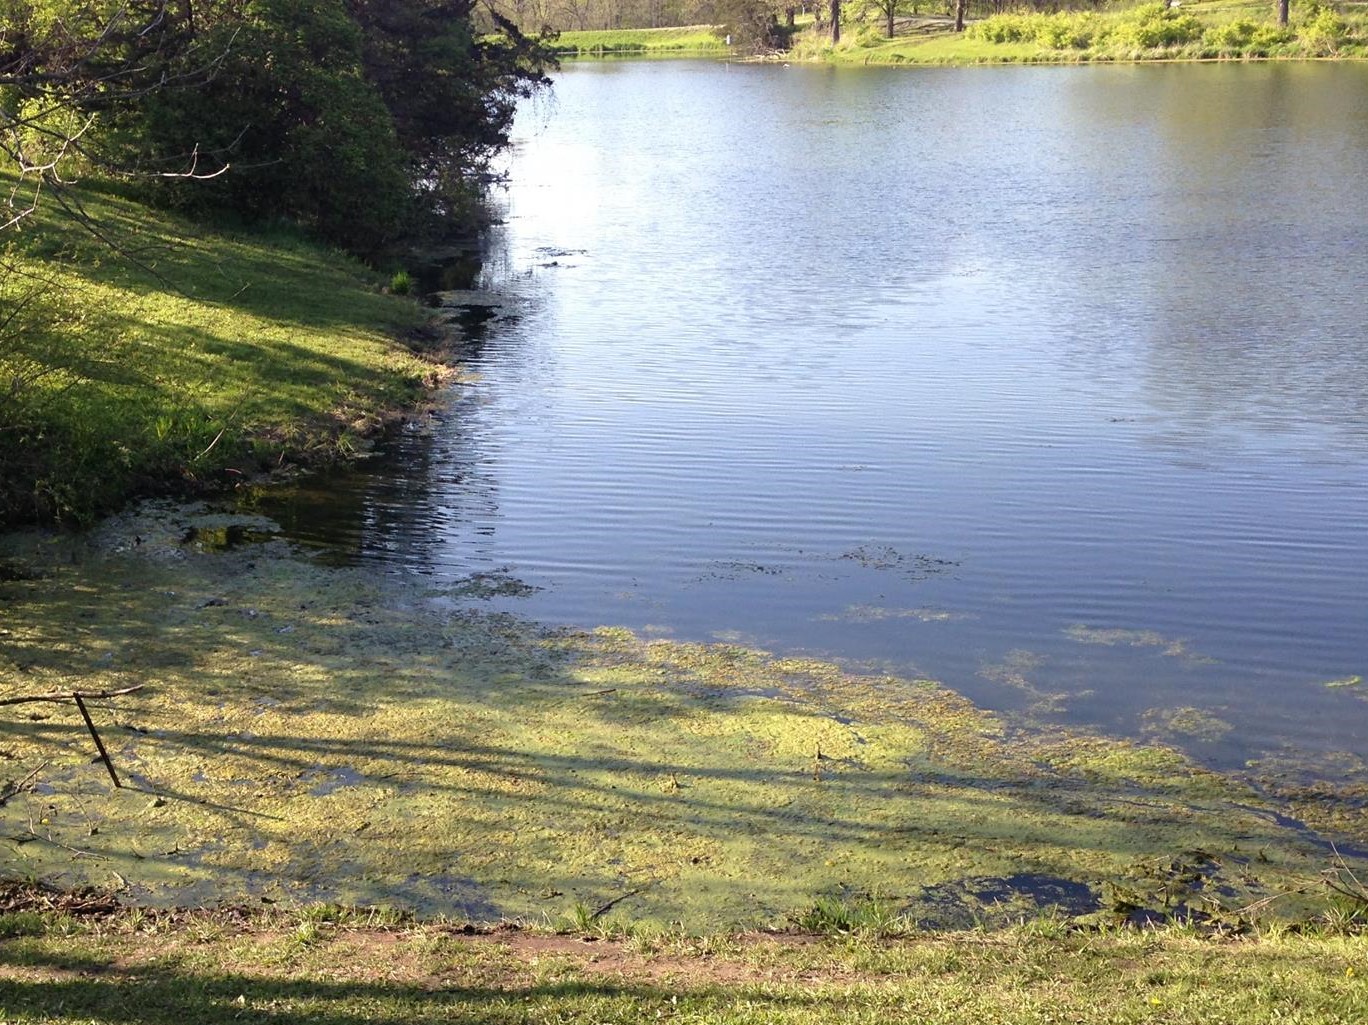
In addition to Gulf Hypoxia, phosphorus that washes off the land is causing algae blooms in many of Iowa’s lakes. Overnight, these algae blooms can use up the oxygen that fish and other aquatic critters need to breathe. Some kinds of cyanobacteria can produce toxins that can harm people and pets. Algae blooms are nuisance for those who would like to swim, fish, boat, or water-ski in those waters. We can address two problems at once if those 1000 acres of cover crops are planted in the watershed of Hickory Grove Lake, Saylorville Lake or other water bodies suffering from an excess of green.
In addition to Gulf Hypoxia, nitrogen that washes off Iowa farmland can cause a problem for cities that pull their water from a river, or from wells close to and influenced by a river. The Des Moines Waterworks and the Raccoon River watershed have rightly gotten a lot of attention, but other cities in other watersheds (like Boone, on the Des Moines River) also are dealing with high nitrate in their source water. Cover crops in the right watersheds can help protect those water supplies.
Nitrogen and phosphorus can also cause algae blooms in creeks and rivers, but the science is more complicated than in lakes, and not often done. For example, while the Squaw Creek Watershed Management Plan demonstrates that nitrogen and phosphorus levels in the creek are high, it does not make the case that meeting our nutrient reduction goals will protect drinking water, improve fisheries, make for safer recreation in Squaw Creek. Maybe that’s a safe assumption, but I honestly don’t know.
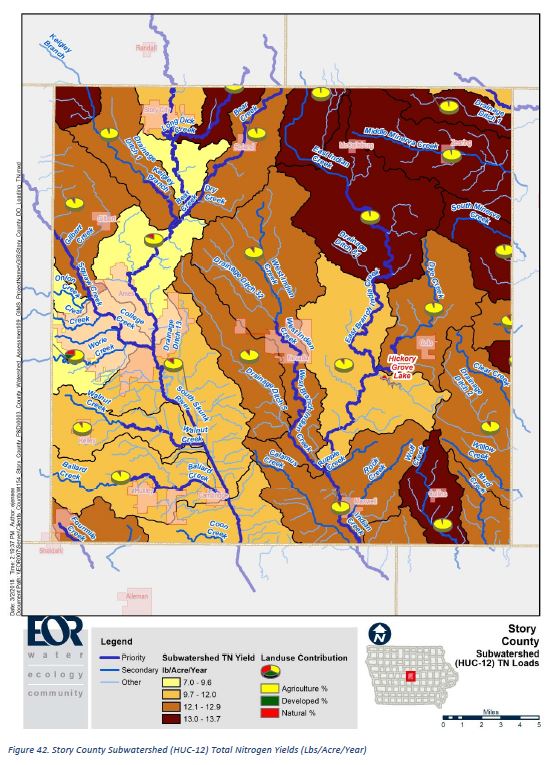
2. Plant cover crops where they can reduce the most nitrogen
Here’s a map of nitrogen load by HUC-12 watershed in Story County, based on landcover. This kind of model would be handy if you wanted to guess which stream has higher nitrate levels at its outlet. If I plant 1000 acres of cover crops south of McCallsburg (in the “Drainage Ditch 81” hydrologic unit) will I get more nitrogen reduction than if I plant them west of Ames (in the Squaw Creek-Worrell Creek hydrologic unit)? Nope. The pounds/acre estimate here is for the whole watershed, and it’s based purely on landcover in that watershed. Unlike the larger watershed, a field west of Ames wouldn’t be 20% developed, it’d be 100% agriculture, so with this model we can’t assume it’d be different than a field anywhere else in the county. More sophisticated computer models like SWAT or SPARROW incorporate things like soils, slope, and county-level fertilizer sales as well as landcover, but it’s hard to tell which of those things is driving the results.
Other models like the Nutrient Tracking Tool are field scale, and can be used for this kind of prioritization. Running through some quick scenarios, I estimated that cover crops on a tile-drained field in the Squaw Creek watershed could prevent 9 lbs/acre of nitrogen loss each year, versus 3 lbs/acre in an undrained field in the watershed. Computer models can be helpful, if we’re clear about their purpose and limitations.
3. Plant cover crops where they can reduce the most phosphorus and sediment
Cover crops have gotten more traction in hilly southern Iowa, where soil erosion is a more visible problem and no-till is common. From a standpoint of tons of soil erosion prevented, or pounds of phosphorus loss avoided, it makes sense to plant on fields with steep slopes and erodible soils. Models like RUSLE can be helpful for this.
4. Plant cover crops where their water quality benefits can best be measured
1000 acres of cover crops will make a bigger splash in a small watershed than in a big one. A small change in water quality is difficult to detect. Just like a poll that talks to a small number of people has a margin of error, a water testing program that samples only 12 or 24 days out of the year will have some uncertainty attached to the results. I’ll be talking more about “minimum detectable change” in future posts, but suffice to say that margin of error is usually closer to 10 or 20 percent than 1 or 2 percent. That means we need to give some thought to where conservation practices will be located relative to long-term water monitoring sites if we hope to document their effects with water monitoring.
Location of monitoring sites in Story County, and agency monitoring
Row-cropped acres in watershed
Expected N and P reduction at monitoring station from 1000 acres of cover crops in watershed
5. Plant cover crops where it is most cost-effective for the producer
We do some of this unintentionally. A farmer who can figure out how cover crops will make financial sense for their operation–cutting a pass for weed control or loosening compaction, providing forage for cattle, or protecting yields in wet or dry years–is more likely to sign up when the cost share being offered is $25-$35/acre. Those that think they will lose money will pass until we offer better incentives–for example, Maryland was paying up to $90/acre and has gotten more takers.
This is also the idea behind “precision conservation” promoted by Land O’Lakes and other retailers. With precision yield monitoring, conservation practices like wetlands, prairie strips, or buffers can be placed so as to minimize lost revenue. Poorly draining or steep parts of a field might actually cost more to plant, till, and fertilize than it generates in revenue, so farmers could install conservation practices and even come out ahead.
That’s 5 ways to get more conservation bang for our buck. Let’s be more clear about which of these we’re hoping to achieve when we do watershed planning, and more creative about how we support good stewardship.
Does this make sense? Are there other ways to be more cost-effective with conservation? Leave a comment!
It turns out that stream monitoring is quite compatible with social distancing. 28 volunteers participated in the Squaw Creek Watershed Coalition’s 13th spring water quality snapshot on May 30 and 31. Together we tested water quality at 43 sites on Squaw Creek, its tributaries, and the South Skunk River! This time, Prairie Rivers of Iowa assembled the equipment, organized the event, and entered the data. We’re happy to support this dedicated group of citizen scientists in better understanding and drawing attention to our local rivers and creeks.
Update: The name “Squaw Creek” was officially changed to “Ioway Creek” in February of 2021, to be more respectful to native peoples. Over the next year, expect to see some changes to the name of the Coalition, as well as maps and signs.
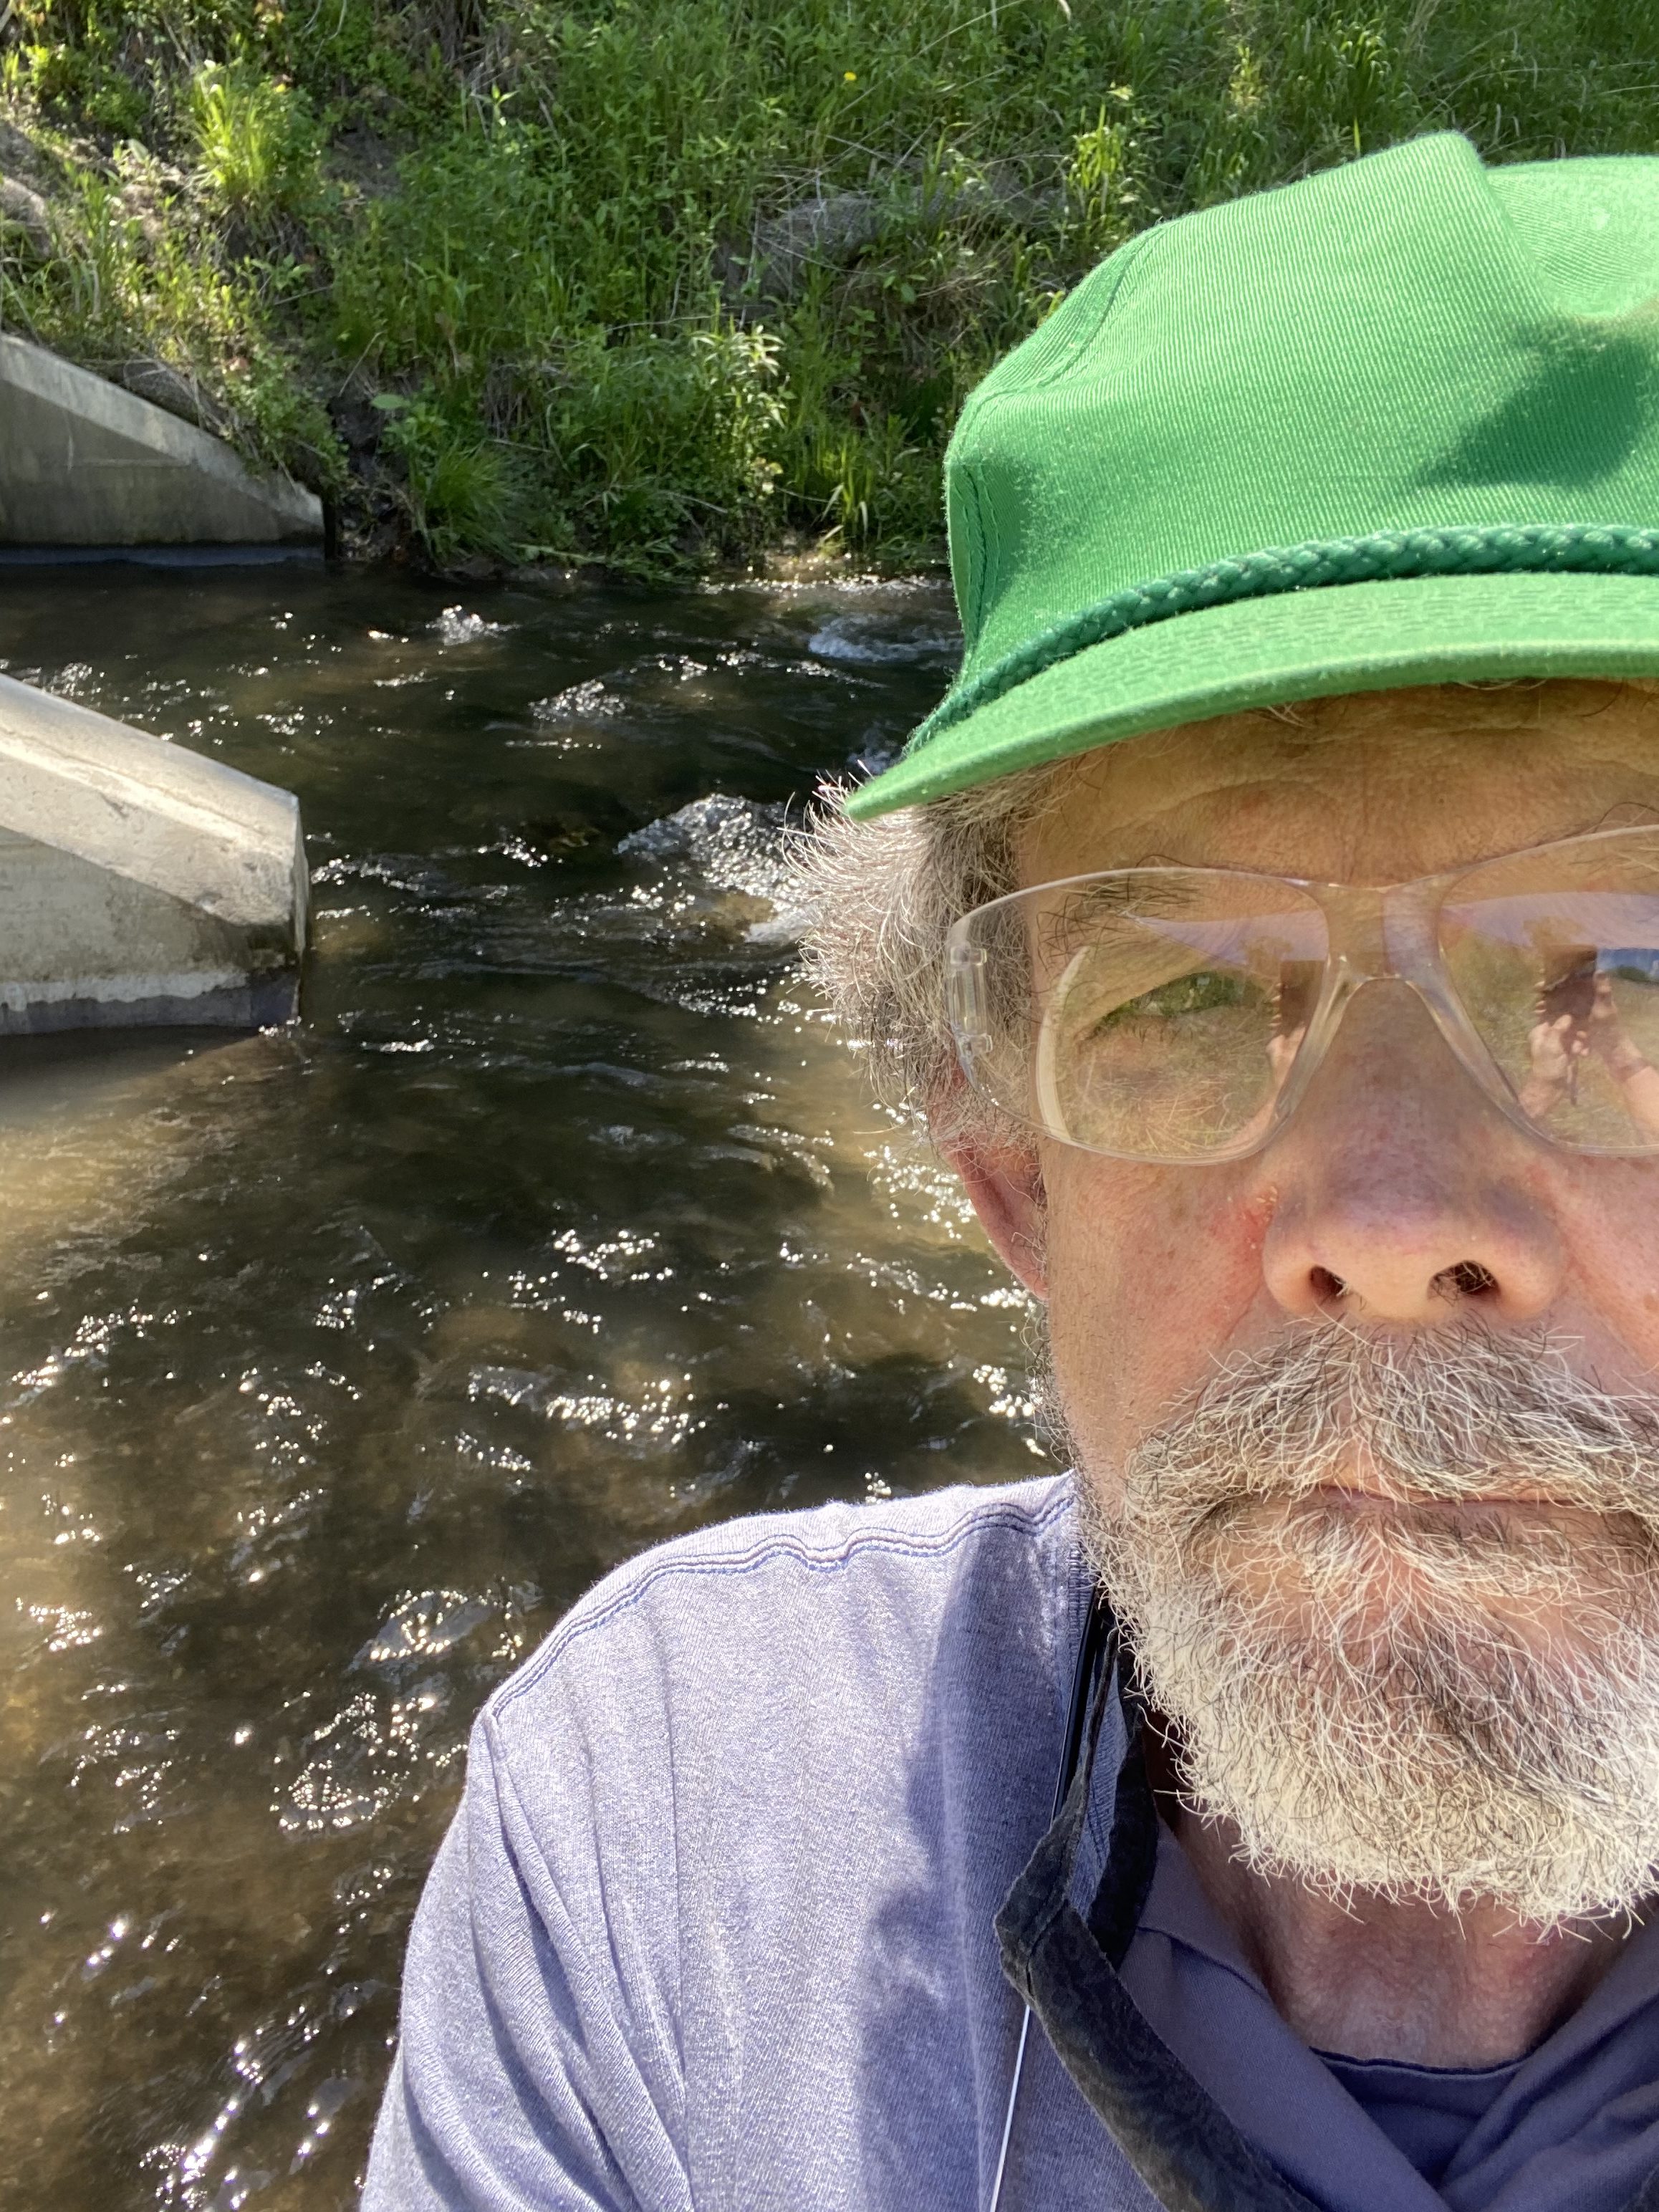
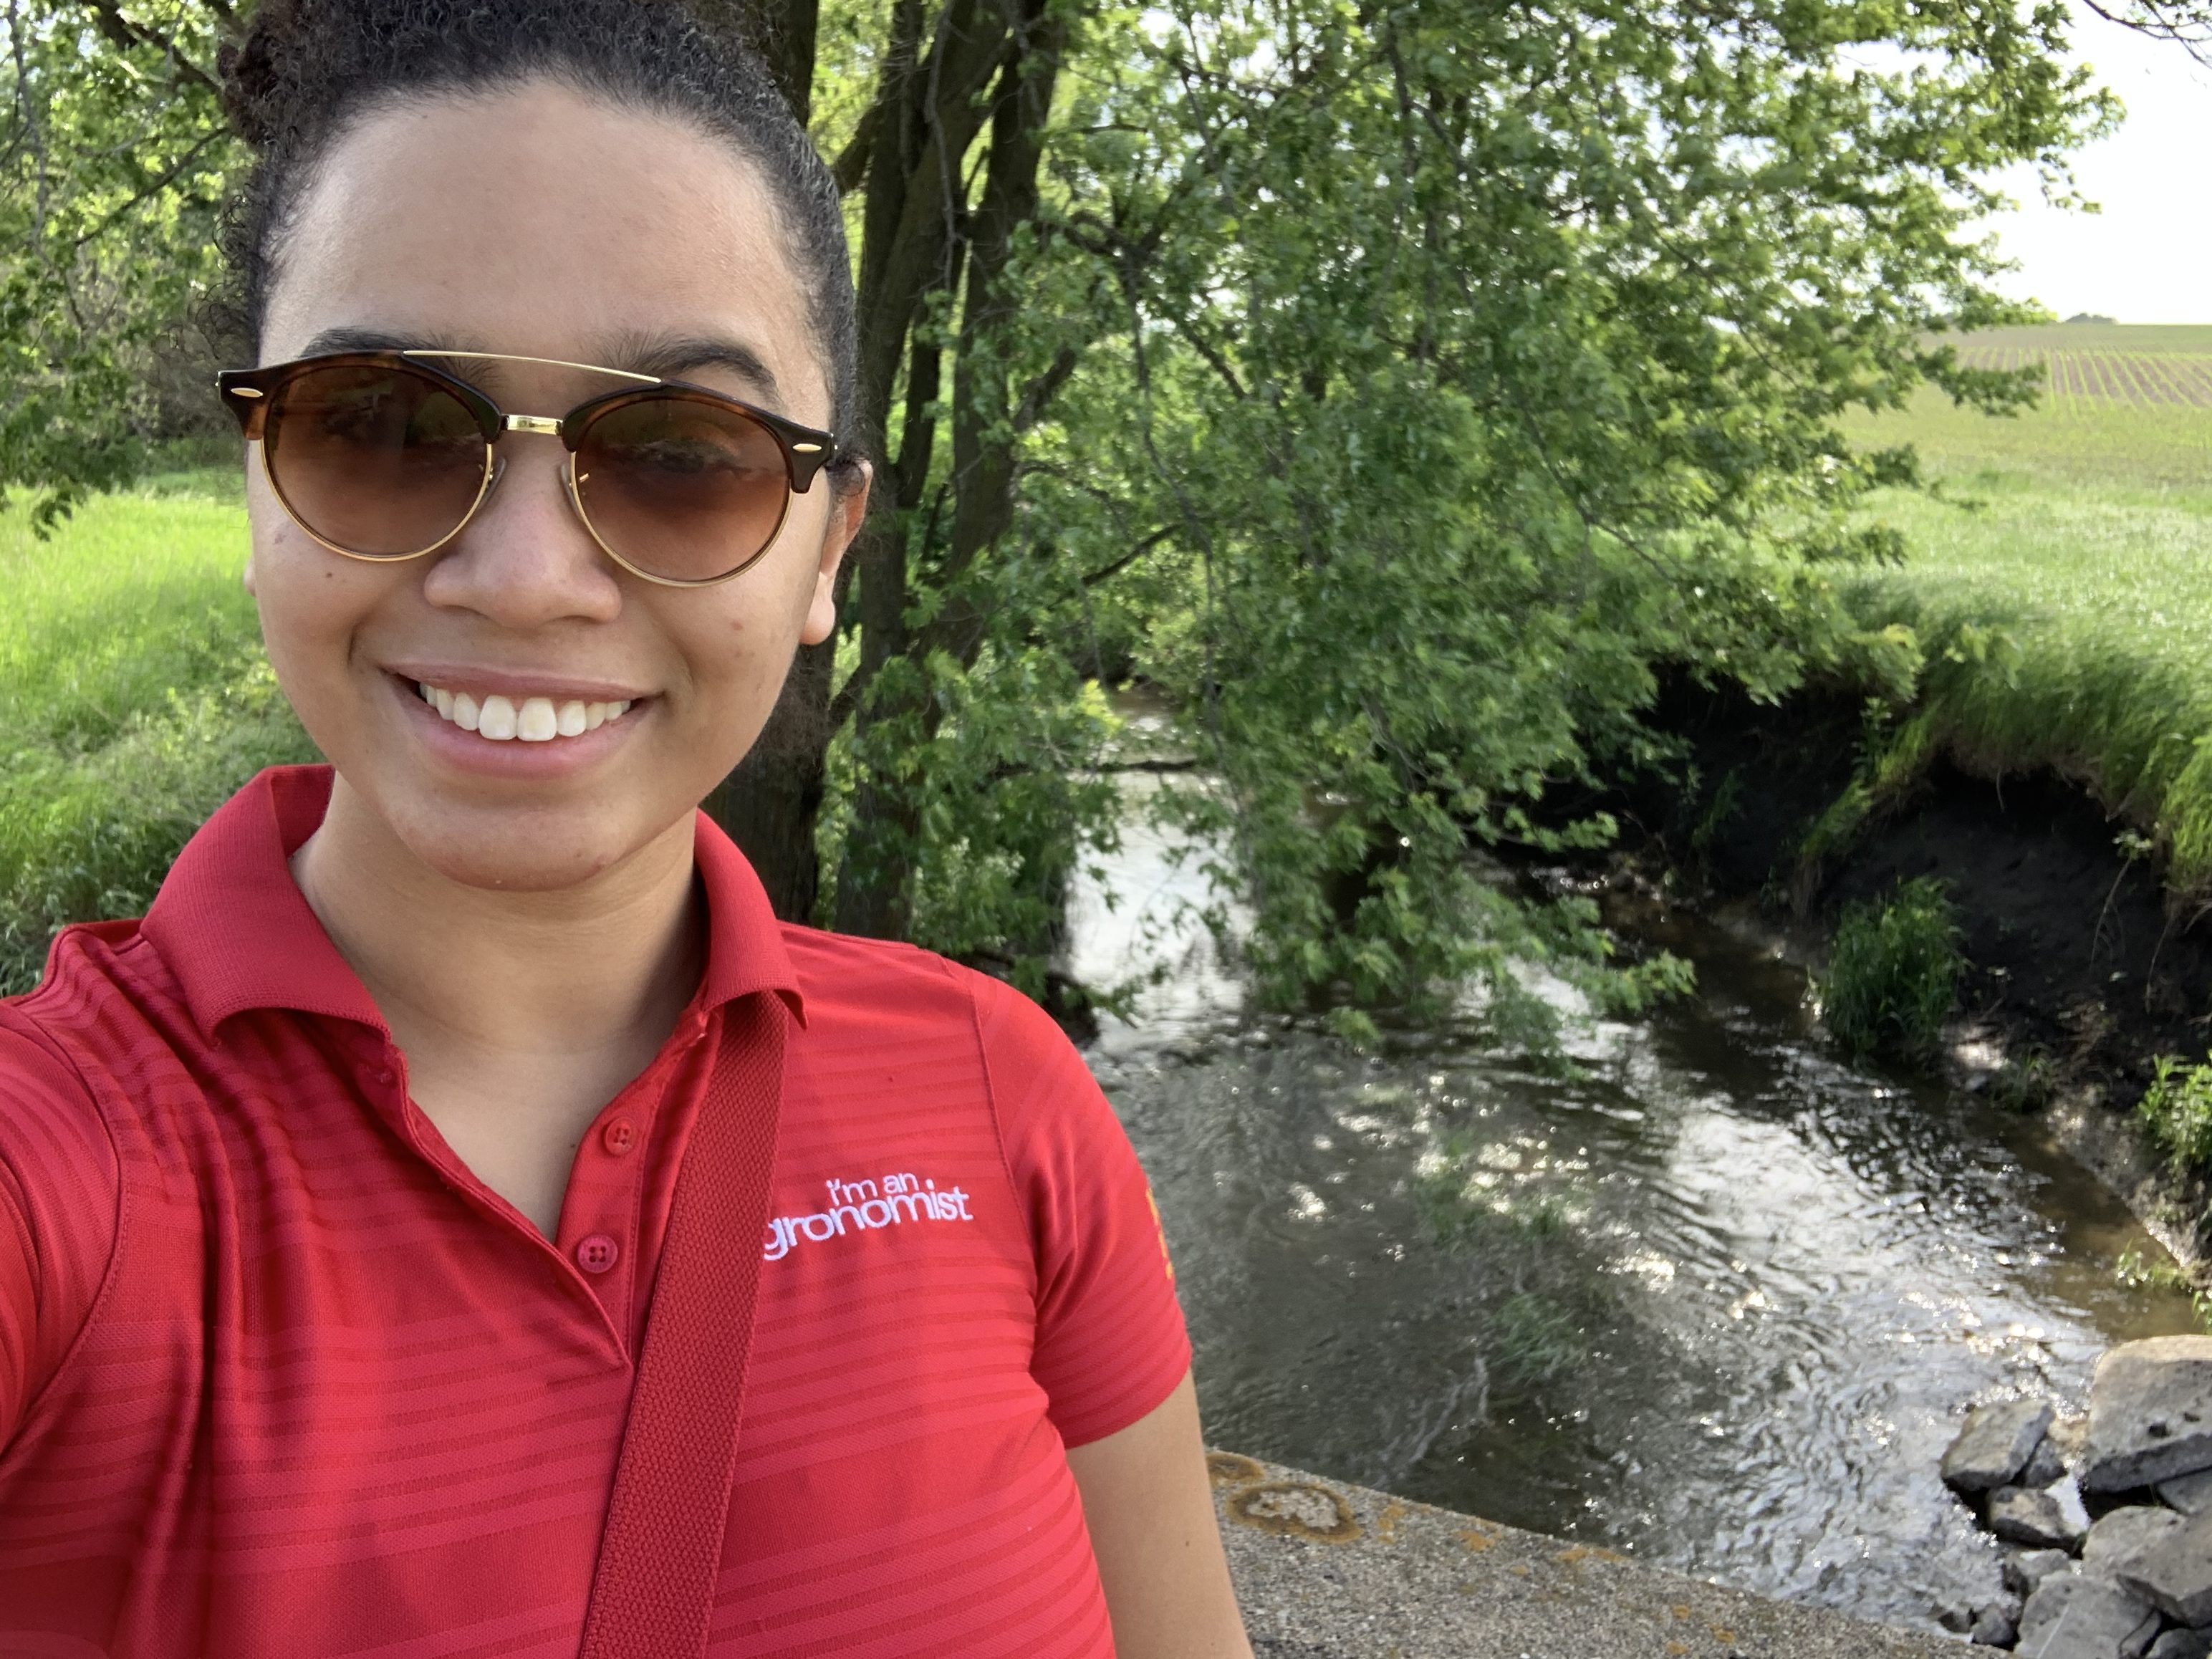
Here’s a few selfies taken by participants, a mix of long-term volunteers and new faces.
The Kopecky family by the South Skunk River
Jeff White at Gilbert Creek
Kelly Nascimento Thompson at Glacial Creek
Kurt Plagge and Mary Burnet at Onion Creek
As the name implies, this is a snapshot in time. The water quality on one sunny weekend in May is not necessarily representative of the month, let alone the year. As described here and here, water quality can change dramatically in response to a big rainstorm. But for this moment in time, testing many sites gives us a very detailed picture of the Squaw Creek watershed.
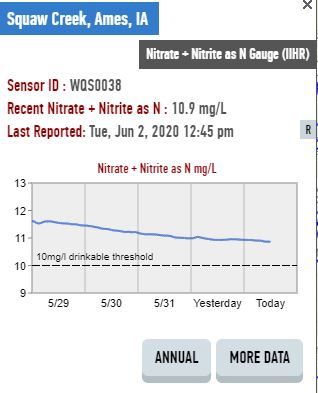
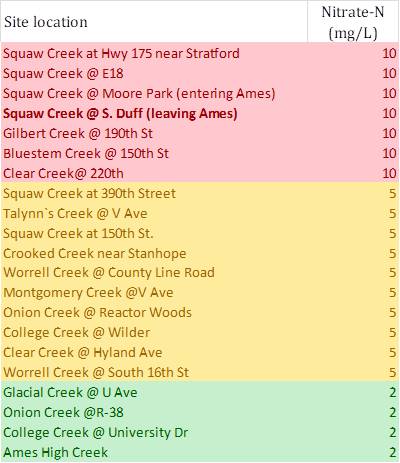
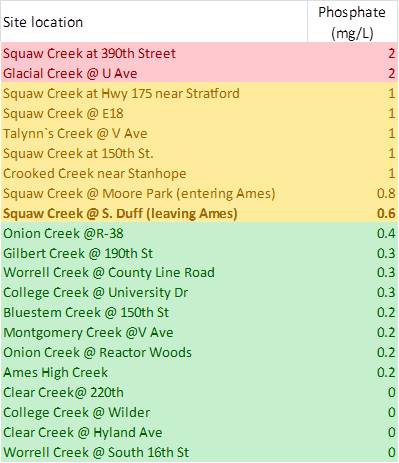
For example, during May 30 and 31, nitrate in Squaw Creek at Moore Park and other locations in Ames was quite high (11-12 mg/L) exceeding the drinking water standard (10 mg/L). Where is that nitrate coming from? All over its 147,000 acre watershed, but in some tributaries more than others, as you can see in the color-coded chart below. Nitrate was especially high in the upper reaches of Squaw Creek, Gilbert Creek and Clear Creek and especially low in Glacial Creek (which has a series of constructed wetlands and a lot of pasture) and College Creek (which has an urban watershed). The upstream, rural parts of College Creek and Clear Creek have higher nitrate, which appears to be diluted they move through town.
For phosphorus some of the patterns are flipped. Glacial Creek has especially high orthophosphate (the dissolved form of phosphorus) while Clear Creek is especially low.
There’s lots of interesting patterns to explore, and more data from this and previous snapshot events here. If you’re curious about water quality, subscribe to our blog, I’ll be continuing to interpret data from this and other sources.
Thanks to all our volunteers for collecting it!
Questions about stream monitoring, or observations from our volunteers? Post a comment.
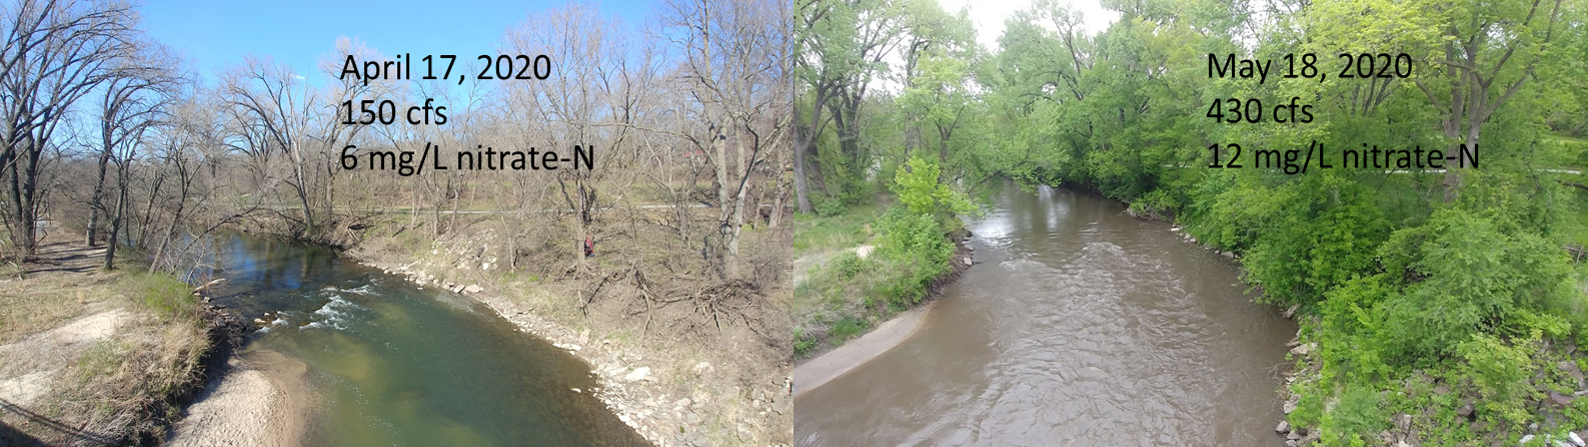
Last weekend’s rains (5-17-2020) provide a clear illustration of how water and nitrate make their way to Squaw Creek.
Squaw Creek at Brookside Park
How water reaches Squaw Creek after a rain
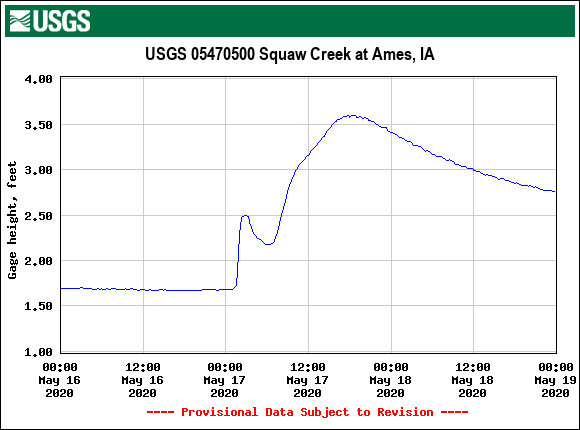
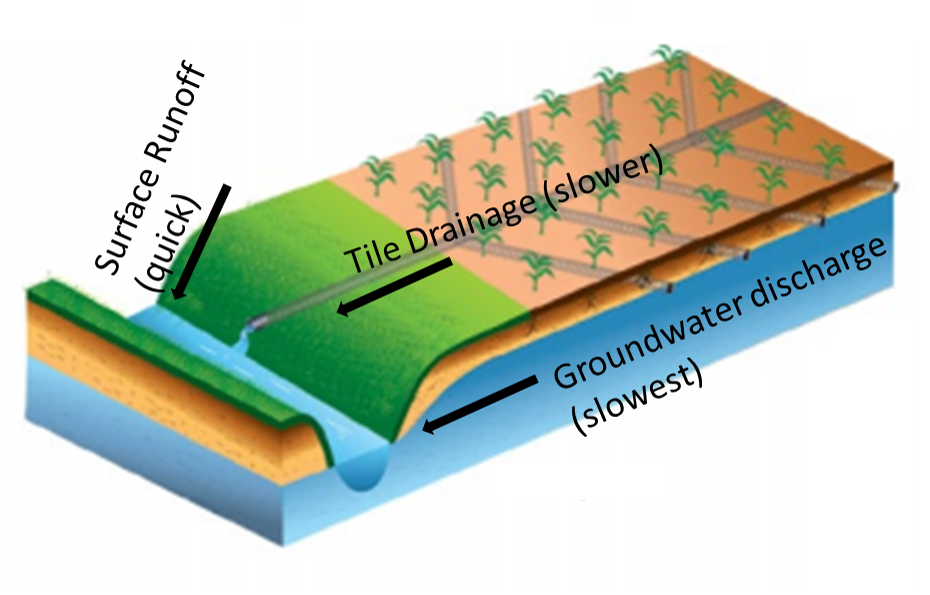
It started raining late Saturday night and stopped around 3AM Sunday. The rain gage outside my house in Ames showed 0.9 inches. The water hitting my driveway and other paved surfaces in my neighborhood enters a storm sewer that goes directly to a tributary of Squaw Creek. (In newer neighborhoods, the water would be slowed down by a pond or detention basin). This runoff takes about an hour to make its way down Squaw Creek to the USGS stream gage at Lincoln Way. In response to urban runoff and the rain that fell directly on the channel, we can see a quick rise in the water level, and quick fall.
Over the next 15 hours, Squaw Creek rose another foot as it was joined by water that fell as far away as Stratford and Stanhope. Other than urban areas, we probably didn’t see much runoff from the storm, which was relatively gentle and fell on soils that weren’t particularly steep or waterlogged. The fall in water level Sunday afternoon and Monday was more gradual, reflecting the release of water from drain tiles and groundwater.
Figure adapted from University of Michigan Extension
How nitrate reaches Squaw Creek after a rain
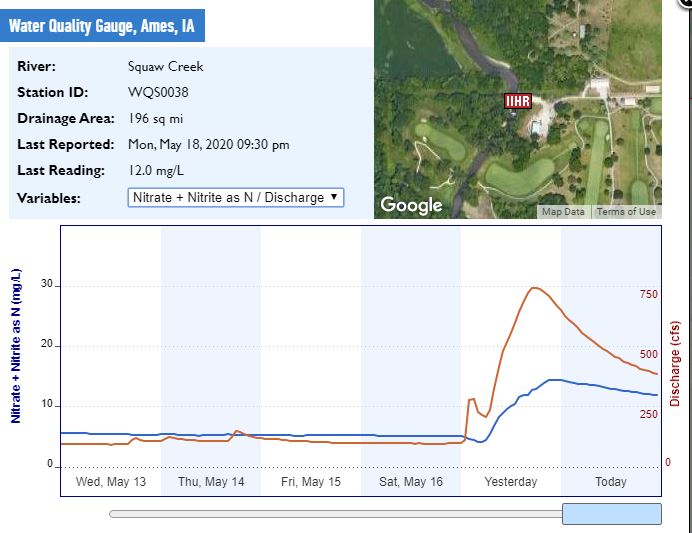
It’s well-known that tiles and ditches provide a direct pathway for nitrogen to leak out of the soil in corn and soybean fields. Think of cover crops as a way to plug the leak, and bioreactors, saturated buffers, and wetlands as a bucket placed underneath. You can watch the leak from last weeks’ storm with IIHR’s nitrate sensors. This graph is from a sensor installed in Squaw Creek in Moore Park, where it enters Ames. (The colors are the reverse of what you’d expect–brown is streamflow, blue is nitrate).
The nitrate concentration in Squaw Creek fell from 5 to 4 mg/L overnight, diluted by direct precipitation and urban runoff, and then rose to 14 mg/L as water from drainage tiles made its way downstream. As tile flow tapers off, nitrate concentrations gradually fall toward the lower levels seen in groundwater.
Nitrate drops as you move downstream
In Hardin County, there’s a nice set of three sensors that clearly showed what happens as water moves downstream during this storm. Not every stream demonstrates this behavior, but many do.
At the tile outlet, nitrate levels are highest to begin with (10.9 mg/L) and show the sharpest increase, spiking to 18.3 mg/L by 5AM after some initial dilution. Since the water takes some time to reach the next downstream sensor, Tipton Creek near Hubbard, the peak doesn’t happen until 8 PM, rising from 8.6 mg/L to 17.1 mg/L. Further downstream in the South Fork of the Iowa River, near New Providence, water is reaching the sensor from several tributaries, smoothing out some of the changes. Nitrate rises from 4.5 mg/L Saturday night to a peak of 16.2 on Monday morning at 11:00.
There are several reasons why nitrate tends to decline as you move downstream. First, tile systems drain mostly agricultural land, while a larger stream will also drain some field margins, pasture, and woodland. Second, nitrate is removed from the water by algae, plants, and microbes. Waterlogged organic matter, whether in a low spot in a field, a wetland, a stream bottom, or a woodchip bioreactor, is good habitat for denitrifying bacteria. Third, many Iowa streams flow from northern Iowa southeast to the Mississippi River, or southwest to the Missouri River, and as you get into southern Iowa, the land becomes hillier, tile drainage becomes less frequent, and pasture more common.
Tile drained fields lose a lot of nitrogen in spring. That’s not news to anyone, but hopefully this helps you visualize and understand the process.
Update, 5/29/2020: We had even bigger rains the following week, but spread over several days, so the pattern was less clear. We’re still seeing nitrate concentrations >10 mg/L in the rivers, and >15 mg/L at tile outlets.