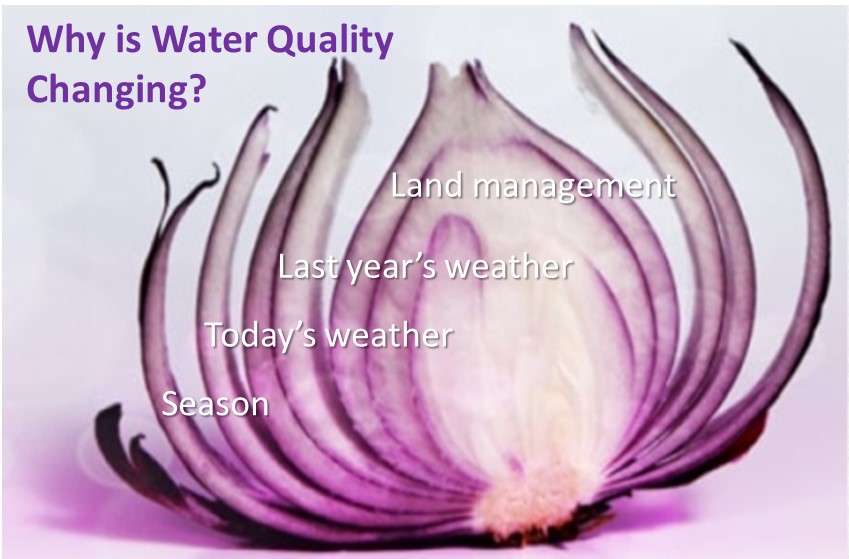
The Best Nitrogen Analogy Ever

The Best Nitrogen Analogy Ever

Imagine the nitrogen cycle is a trust fund kid with a gambling problem.

 The young man (a corn field) is very rich (has rich black soil) but the money (nitrogen) he inherited from his father (the prairie) is locked in a trust fund (soil organic matter). Only a small portion of the funds are released to him each year (mineralized) following a complicated schedule determined by the trustees (microbes in the soil). In order to maintain the lifestyle to which he has become accustomed (provide enough nitrogen to the crop for good yields), he needs supplemental income (nitrogen from commercial fertilizer or manure). His sister (a soybean field) does not need to work (apply fertilizer) because she can borrow money from her well-connected husband (symbiotic nitrogen-fixing bacteria) but she also receives payments from the trust (mineralization).  She helps her brother out (corn needs less nitrogen fertilizer following soybeans) but not directly (soybeans actually use more nitrogen than they fix, so the benefits of the rotation has more to do with the behavior of the residue and disrupting corn pests).

A Richie Rich cartoon, but with nitrogen

Both siblings have a gambling (water quality) problem and are terrible poker players. Whenever they’re feeling flush with cash (when other forms of nitrogen have been converted to nitrate) they blow some of it playing cards (nitrate easily leaches out of the root zone when it rains), but the extent of the losses vary and debts aren’t always collected right away (nitrate leached out of the root zone may not immediately reach streams). They struggle with temptation more than their cousins (alfalfa and small grains) because they come from a broken home (the soil is fallow for large parts of the year) and because bills and income don’t arrive at the same time (there is a mismatch between the timing of maximum nitrogen and water availability and crop nitrogen and water use).

“”Okay, Dan, that’s very clever, but what’s your point?

Well, having compared the soil to a trust fund, I can now say “don’t confuse net worth with income.” You’ve probably heard that there 10,000 pounds per acre of nitrogen stored in a rich Iowa soil. That’s true but misleading. The amount actually released each year by decomposing organic matter (net mineralization) is only a few percent of that, comparable in size and importance to fertilizer or manure.  Here’s an example nitrogen budget.

Example nitrogen budget, for Tipton Creek in Hamilton & Hardin Counties

On average and over the long-term, we know that fields and watersheds with higher nitrogen applications (taking into account both manure and commercial fertilizer) leach more nitrate into the water. On average and over the long-term, we know that that farmers can profit by reducing their application rate to the Maximum Return To Nitrogen (the point at which another pound of nitrogen does not produce a big enough yield bump to offset the fertilizer costs).  Right now, with corn prices high but fertilizer prices going nuts, the MRTN is 136 pounds per acre for corn following soybeans, while in the most recent survey I could find, farmers reported applying an average of 172 pounds per acre.  So there’s room to save money while improving water quality!

But having compared nitrate leaching to gambling, I can also say “don’t confuse a balance sheet problem with a cash flow problem.”  In any given year, it’s always a gamble how much of the nitrogen that’s applied will be washed away and how much will be available to the crop.  Maybe some farmers are passing up on an opportunity to increase their profits because they’re not comfortable with the short-term risks.

Figure from John Sawyer
current MRTN

 Farmers say that extra nitrogen is cheap insurance.  If that’s true, maybe we need crop insurance that makes it easier to do the right thing, not a more precise calculator.

High nitrate this spring: where and why

High nitrate this spring: where and why

The Des Moines Waterworks was forced to use their nitrate removal system for the first time in five years. Our spring snapshot found high nitrate concentrations in streams across Story County. On my way to speak at the CCE Environmental Expo in Mitchell County, I dipped a test strip in the Cedar River near Osage and measured 16 mg/L. Looking at the Iowa Water Quality Information System there’s orange (nitrate greater than 10 mg/L) across much of the state and spots of dark red (nitrate greater than 20 mg/L) in Story, Hamilton, and Hardin counties. What’s going on?


flowing drain tile

Well, differences in land use, soils, topography, and farming practices make for strong regional differences in water quality.  For some streams like the North Raccoon River, this is a return to normal.  For some streams, like the Cedar River, current conditions are unusual. To illustrate this, I’ve invented my own graph, which compares highest nitrate concentrations observed this spring (the blue dot) to the entire 10-20 year record (a black band showing the range, and a black square showing the median). The data comes from Iowa DNR’s Ambient Stream Monitoring Network; I will update these graphs once June data is available. A sampling of sites is shown at right, but the entire graph can be downloaded as a PDF here.

nitrate in selected rivers

Northwest Iowa is still suffering from drought, and that means the Floyd River near Sioux City (which usually has some of the highest nitrate concentrations in the state) is barely flowing and has very low nitrate concentrations. As we saw last year, nutrient concentrations tend to be low during dry conditions except where there is a strong influence from point sources of pollution. Most of the rest of the state is back to normal, and nitrate that accumulated in the soil during two dry years is now getting flushed out. These maps are taken from the National Drought Mitigation Center at the University of Nebraska-Lincoln.  I’ve drawn in the approximate location of the watersheds for the monitoring sites in my example.

map showing drought abating

Weather whiplash in agricultural regions drives deterioration of water quality.”  That’s the title and conclusion of a paper that studied previous episodes when a wet spring followed a dry summer and fall.  The 2012 drought was much more severe than 2021, impacting yields so that less nitrogen was taken up by the crop and removed in the grain, and maybe that’s why nitrate in 2013 and 2014 was so much higher than it is now.  I’ve compared spring highs for several sites and years, normalizing by the long-term average.  It’s not clear to me whether weather whiplash increases the overall mass (load) of nitrogen that gets washed away, or just alters the timing (moving in one year what would have been parceled out over two), but high concentrations are a concern for communities like Des Moines and Cedar Rapids that get their drinking water from a river or river-influenced wells. 

map showing shift out of drought in 2013
map of weather whiplash in 2014
graph showing when nitrate was higher than usual for select sites

I’m procrastinating on the work I’m supposed to be doing because “Hey look!  Data!” and I have to satisfy my curiosity.  If you’d like to see us do more water quality analysis beyond Story County, let us know, and support us with a charitable donation so it can become work I’m supposed to be doing!

It’s Rude to Point, but…

It’s Rude to Point, but…

By my calculations, over 65% percent of the nitrogen load in Ioway Creek on May 20 came from less than 1 percent of the land area in the watershed.  We still don’t know why.

Revised May 31

Many people assume that fertilizer applied to turf grass is a major source of nitrogen and phosphorus pollution in Iowa.  At a presentation to the Ames City Council, I was asked if a public awareness campaign aimed at lawn care professionals and homeowners would be an effective way to improve water quality in Ioway Creek.  If we’re talking nitrogen, I don’t think so:

  1. Because turfgrass covers a tiny proportion of the land in most Iowa watersheds, compared to cropland.
  2. Because turfgrass is a perennial. Having something growing and taking up available nutrients year-round is the principle on which cover crops reduce nitrogen loss.
  3. Because there was a study by Dr. Keith Schilling that found very low nutrient levels in shallow groundwater below six Iowa golf courses.
Turf grass in the rain

To that list, I can add local water quality monitoring including lab testing and sensor results from May.  Nitrate in Ioway Creek and the South Skunk River were the highest we’ve seen for a few years, but while rural tributaries ranged from 12-20 mg/L of nitrate, College Creek (an urban watershed with plenty of turf grass) measured only 2.3 mg/L.

But even if turf grass in general isn’t a serious water quality problem, maybe some specific areas of turf grass are a problem.  That’s what I thought after reviewing the data from our spring water quality snapshot on May 17.  Volunteers found a big difference in nitrate levels between South Duff Ave and other sites in Ames.  I wondered if it could be a mistake, so I went back out on May 20 with a bottle of test strips and a smartphone app that enables more precise measurements.  It wasn’t a mistake (nitrate in Ioway Creek increased from 8.6 mg/L to 24 mg/L in two miles), but the results still weren’t making sense, so I kept testing and testing until I assembled the map below.  By my calculations, 65% of the nitrate load in Ioway Creek that day was coming from just 1,500 acres!

map showing nitrate results on May 20

The 1,500 acres includes Coldwater Golf Links, and the pattern looks like what I’d expect to see if the golf course was overapplying fertilizer.  However, the golf course superintendent has informed me that fertilizer has not been applied since fall, and then only at a low rate.  A volunteer tested two ponds on the course and found low levels of nitrate (1-2 mg/L).

The 1,500 acres include some developed areas north of creek drained by storm sewers, but I tested water trickling from two outfalls on May 20 and found very low nitrate levels: 0.5 mg/L and 3.1 mg/L.

Worrell Creek at golf course

The 1,500 acres acres also includes two construction sites: a flood mitigation project near South Duff Ave and an ISU recreation complex east of Jack Trice Stadium.  The photo shows severe bank erosion where drainage from the ISU construction site enters the creek.  An inspector with the Iowa DNR noted problems with erosion control earlier this spring on the South Duff project.  However, if the nitrate spike were linked to erosion, I’d expect to see high phosphorus and low transparency.

Honestly, I’m not sure what’s going on here.  It’s not a pattern we’ve seen in previous years.

erosion on Ioway Creek between Grand and Duff avenues

When interpreting this kind of data, there is a risk of jumping to conclusions and unfairly pointing fingers.  In my first draft of this article, I suggested that Coldwater Golf Course was the source of the nitrate and the bank erosion.  That was premature.

However, there is also a risk that we will waste time and money on the wrong solutions or the wrong areas if we don’t test water or don’t follow where the data is pointing.  It’s clear from this month’s data and many other rounds of testing that water quality impacts are not uniformly distributed across the landscape.