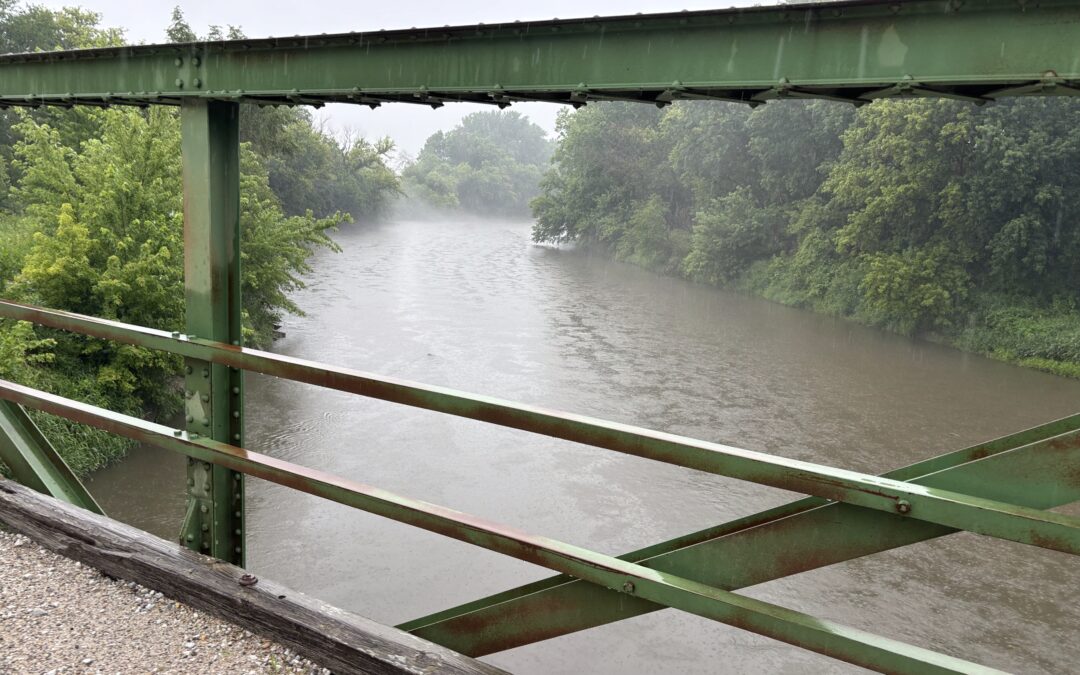
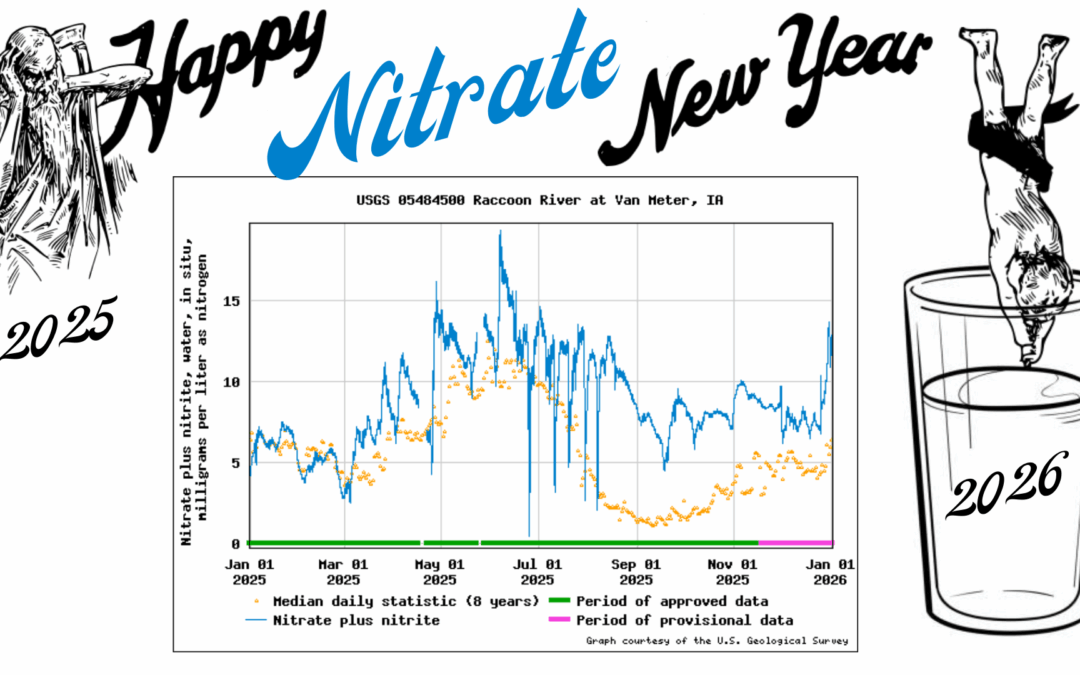
When the ball dropped on New Year’s Eve, nitrate in the Raccoon River was once again above the drinking water standard, closing out a bad year for water quality in Iowa. Below, I’ve compared this year’s nitrate levels to long-term averages at sites in Iowa DNR’s Ambient Stream Network with at least 20 years of data to get a sense for where and when nitrate was highest and what was unusual about 2025.
To understand these patterns, it’s important to remember that 2025 was not a uniformly wet year. Heavy rains in July broke or came near to breaking some records and caused flash flooding in many communities. These rains also raised the water table enough to keep drainage tiles flowing into into the fall. However, most of the state received less than average rainfall from January through May and from August through December. In a band from Ames to Charles City, that works out to a much wetter year than normal. In other parts of the state, like Dubuque, Ottumwa, and Red Oak, that works out to a much drier year than normal.
Nitrate was much higher than normal in the Boone River, Skunk River, and many others in northern and central Iowa, especially in July and August. Nitrate was within 1 mg/L of the long-term average for the Nishnabotna and other rivers in southern Iowa and for the Rock and Floyd Rivers in northwest Iowa. In the table below, red indicates nitrate was higher than average, blue is lower than average, and white is close to the long-term average.
There are some unusually high readings (25 mg/L in the South Skunk River in January) and unusually low readings (3.3 mg/L at Beaver Creek In July) that may have been collected during a storm or other event that is not representative. This is a limitation of monthly grab samples and one reason why maintaining Iowa’s network of real-time nitrate sensors is important. The Ioway Creek sensor was removed at the end of 2024, but the pattern I documented here here (a quick flush of low nitrate surface runoff followed by a gradual release of high nitrate drainage water) happened over and over, in many places in 2025. These kinds of leaks can be avoided with changes in cropping systems and land use, reduced with better nutrient management and cover crops, or intercepted and treated with saturated buffers and wetlands, but we’ll need a lot more of them to prevent another bad year like 2025.
In an interview with KCCI, Iowa Governor Kim Reynolds blamed the weather for high nitrate levels in the Raccoon and Des Moines rivers that led to an unprecedented outdoor watering ban for the Des Moines metro and dismissed any suggestion that Iowa needs to change its policies. Milli Vanilli’s 1989 hit “Blame it on the Rain” captures the vibe perfectly, so I covered the song and made a silly video with footage from the interview. However, the situation is no laughing matter.
Let me explain the situation as simply and clearly as I can. The high nitrate levels we are seeing this spring are not a fluke, drinking water is not completely safe in many communities across Iowa, and if we stay the course with Iowa’s Nutrient Reduction Strategy we will be waiting a long time for things to get better.
You can’t have it both ways
It’s true, nitrate pollution in rivers is influenced by both rainfall and recent drought. This has been a recurring theme in my analysis of water quality data (most recently here, and most rigorously here). But the Governor and her administration want to have it both ways. When nitrate in the Cedar River dropped due to favorable weather, they took that as a sign that a voluntary approach was working and took the unusual step of trying to withdraw a pollution budget that might have placed limits on new pollution from industry. Just last fall they were arguing that the following rivers should be removed from the Impaired Waters List, based on a 10% rule that makes no sense in the context of drinking water. The table below shows the data that they’re using to make those determinations.
Regardless of whether they meet the technical threshold for impairment, as a practical matter, the Raccoon River and Des Moines River regularly have nitrate levels high enough to cause problems for drinking water supply. The Central Iowa Water Works had to run their nitrate removal facility in 2024, 2022, 2019, 2018, 2017, 2016, 2015, 2014, and 2013. (This was reported recently by KCCI). It’s the largest such facility in the world, and this year it wasn’t enough!
Nitrate levels this spring are higher than average but not a fluke
The graphs below shows how daily nitrate concentrations and discharge (streamflow) in the Raccoon River this year compares to the median for that time of year. It is unusual for wet weather and high nitrate levels to persist through late July, but nitrate does exceed 10 mg/L about half the time in May and June. If you want to understand long-term nitrate trends in the Des Moines River and Raccoon River, read Chapter 5 of the new source water report commissioned by Polk County.
The Raccoon and Des Moines Rivers are not alone in having high nitrate levels this year. Here is 22 years of weekly data from a site on the South Skunk River, just downstream of Ames. This spring, peak nitrate levels (22 mg/L) were the highest we’ve seen since 2014. Average spring nitrate levels (15.5 mg/L) were the highest we’ve seen since 2015. However, it’s only a little above the long-term average (13 mg/L, indicated with a dotted black line) and ranks 7th out of 23 years for which we have data.
None of the data I’ve seen rules out a slight improvement in water quality in this or other Iowa rivers, masked by the ups and downs of an 8-10 year cycle. However the data does rule out this year being a fluke and us not having to worry about high nitrate levels in the future!
In Iowa, it’s normal for it to rain a lot in the spring. In watersheds with a lot of tile-drained farmland, it’s normal to see high nitrate levels for several days following a rainstorm. Ames is lucky to have a buried sand-and-gravel aquifer with the right geology and chemistry to remove most of the nitrogen before it reaches wells. If we withdrew water directly from the Skunk River, it would exceed the drinking water standard every year. Many other communities in Iowa are not as fortunate in their geology.
Nitrate in Drinking Water Poses a Widespread Health Risk
The Safe Drinking Water Act was written so that we must draw a hard line between “safe” and “unsafe.” Drinking water utilities must meet a Maximum Contaminant Limit of 10 mg/L nitrate as nitrogen. Most large water systems have been able to say on the “safe” side of the line, although it can be costly to do so. However, the standard hasn’t been updated to reflect research on the link between chronic exposure to nitrate in drinking water and various cancers. And really, it’s better to think of health risks as a continuum from “more safe” to “less safe.” The Environmental Working Group created a map a few years ago showing which communities fall in the “not as safe as they could be” range for nitrate in drinking water. Last year, Iowa Environmental Council recently released a report about the health risks of nitrate in drinking water and is now hosting a series of listening sessions on cancer and the environment.
Conservation efforts have been partially offset by increased fertilizer use
Shouldn’t we expect some improvement in nitrogen levels due to the state’s nutrient reduction strategy and the conservation efforts of farmers? I’ve written another article to dig into this question but the short answer is that we can expect at most a 2% reduction in nitrogen losses over the past decade. That’s for the state as a whole, some watersheds are doing better or worse and we don’t have a good tracking system to evaluate it. Most of the progress that we can expect from cover crops and nitrification inhibitors have been offset by increases in fertilizer application rates, which apparently made economic sense to do.
I can’t really blame farmers for acting in their economic self-interest. I do think it’s fair to blame your elected officials if they can’t take drinking water safety seriously and offer better solutions. Just don’t blame it on the rain.
This letter is a satire of DNR’s latest response to the EPA’s partial disapproval of Iowa’s 2024 Impaired Waters List. My first impression was that this was a technical dispute with low stakes for water quality and industry. In theory, adding waters to the 303(d) list can result in stricter permit limits on point sources and open up grants for non-point source projects, but in practice there are many loopholes and backlogs that make that unlikely. However, it still matters whether Iowans are getting honest information about the condition of our waters from the agency charged with protecting them. Iowa DNR’s position is ridiculous and indefensible.
To the attention of the US Environmental Protection Agency, Region 7:
Dear Sir,
In your November letter, you stated that Iowa’s 2024 Impaired Waters List should have included six more river segments that are too polluted by nitrate to fully support drinking water uses. The Iowa Department of Natural Resources strongly disagrees and objects to the implication that Iowa’s water is unsafe, or that DNR is not meeting the letter or the spirit of the Clean Water Act.
Just to be clear, we’re not talking about whether the water is safe for fish or swimming. Toxic algae blooms are a separate issue, for which nitrate is at most a contributing factor. Okay, good we’re on the same page. It’s impossible for most waters to end up on the 303(d) list because of nitrogen or phosphorus pollution, because we still haven’t set numeric criteria to protect aquatic life. The 10 mg/L standard for nitrate applies only to the 61 reservoirs and 18 stretches of river that were designated Class C waters, because they are currently or were historically used as a major source of drinking water.
Ultimately, the goal of EPA and DNR is the same: to ensure that Iowa’s drinking water is safe. It is safe! Well… maybe not for adults. We have the second highest cancer rate in the nation and there is growing evidence that one of the risk factors is long-term exposure to moderate levels of nitrate in drinking water. But nobody is seriously proposing we do anything about that! The issue here is whether tap water is safe for babies, whether nitrate-nitrogen is below the Maximum Contaminant Level of 10 mg/L, as required by the Safe Drinking Water Act.
I’m happy to say that water utilities on these six rivers have been able meet that standard by either:
Mixing high-nitrate river water with low-nitrate water from wells and reservoirs
Asking customers to cut back on water use during times when the reservoir has a toxic algae bloom
Drilling enough wells so they no longer have to use any river water
What, you don’t think giving up on polluted rivers is consistent with the spirit of the Clean Water Act? Hey, if it works… Oskaloosa switched its water source from surface water to an alluvial aquifer years ago, and those wells usually have low nitrate levels. That means that even though we’re still legally required to assess nitrate in the South Skunk River, we no longer have any practical reason to worry about it! Granted, alluvial aquifers are still susceptible to contamination from the adjacent river. Cedar Rapids recently saw nitrate in their wells rise to 9 mg/L, but we’re crossing our fingers that it doesn’t get worse.
Let’s get back to the main issue under dispute. We’re not talking about water quality in 2024, we’re talking about the assessment that we released in 2024, which uses water quality data from 2020-2022. The silver lining of a multi-year drought is lower nitrate levels in the rivers! We are not talking about whether a single sample of river water exceeds 10 mg/L, we’re talking about whether 10% of the samples exceed 10 mg/L.
Sure, a single sample of finished tap water exceeding the 10 mg/L MCL for nitrate would constitute a Tier I violation of the Safe Drinking Water Act, requiring public notice and corrective action. However, so long as that corrective action is needed less than 36 days each year, we think it’s fair for the burden of removing nitrate from the water to fall entirely on drinking water utilities and their customers rather than polluters.
What, you don’t think this 10% threshold for evaluating the source water makes any sense? Well too bad! We’ve gotten away with doing it this way for decades and calling us on it now would violate the no-take-backsies clause of the Administrative Procedures Act. You’ve made the mistake of focusing on the letter of the law rather than the spirit of the law and we can argue about which pollutants go on which list, which list can be assessed using the 10% binomial statistical exceedance approach, and what hoops you need to jump through to change anything until babies are blue in the face!
Should this arbitrary and capricious abuse of federal authority stand, we might someday have to write a Total Maximum Daily Load (TMDL) explaining why it’s impossible to clean up nitrate in the South Skunk River, Des Moines River, and Iowa River. If you carefully read the TMDLs and permits that we’ve already prepared for the Cedar River and Raccoon River watersheds, you’ll see that would be a waste of our limited staff time and paper.
Nitrate in drinking water is under control. Please stop talking about it. If we must talk about nitrate, we prefer the discussion be framed around Gulf Hypoxia and the Iowa Nutrient Reduction Strategy, because that makes the problem seem far away and less urgent.
In November, the EPA partially approved Iowa’s 2024 Impaired Waters List, adding six additional river segments where drinking water use is impaired by high nitrate levels. I think EPA was right to do this, but I have some concerns. This is the letter I submitted during the public comment period.
Dear Water Division Staff,
I agree with the EPA’s decision to add seven river segments to Iowa’s impaired waters list. I hope that this change will lead to greater transparency about how nitrate pollution of surface waters affects the cost and safety of drinking water, but am concerned there will be unintended consequences.
Iowa’s Credible Data Law has sometimes been a convenient excuse to assess fewer waters, and thereby discover fewer problems. However, that doesn’t seem to be the issue here. Each of the water bodies on this list had at least one “credible” nitrate sample exceeding the 10 mg/L drinking water standard during the three year assessment period.
Raccoon River near Des Moines: 38 of 755 samples collected by Des Moines Water Works exceeded 10 mg/L
Cedar River near Cedar Rapids: 1 of 36 samples collected by the USGS, and 7 of 151 samples collected by Cedar Rapids Water Works
As I understand it, the issue is the threshold for impairment. Since fewer than 10% of the samples (accounting for some statistical correction factor) exceeded 10 mg/L, IDNR says these sites meet the standard. EPA says they do not.
The Iowa DNR’s position is not defensible. In the draft 2024 assessment, Raccoon River near Des Moines was shown as fully supporting its designated use for drinking water because
A) Nitrate in the Raccoon River exceeded 10 mg/L nitrate less than 10% of the time during the 2020-2022 assessment period
B) Nitrate in finished drinking water at the Des Moines Waterworks never exceeded 10 mg/L.
This makes no sense. Even one sample exceeding the Maximum Contaminant Level for nitrate would constitute a violation of the Safe Drinking Water Act, requiring public notice. To avoid this, the Des Moines Waterworks had to run its nitrate removal facility for weeks in 2022 at a cost of $10,000 a day, as well as blending water from other sources and asking residents to reduce water use. Clearly, poor water quality is limiting that beneficial use of the river water!
However, the South Skunk River no longer supplies drinking water to the City of Oskaloosa. The City now gets its water from an alluvial aquifer, and is able to achieve low levels of nitrate in finished water (1.17 mg/L, in the latest Consumer Confidence report) without expensive treatment. I understand that the Clean Water Act does not allow designated uses to be removed if restoring them is still achievable. However, I hope that in prioritizing and writing TMDLs we can be cognizant of facts on the ground. In the unlikely event that a TMDL for the Skunk Skunk River is written and it leads to stricter effluent limits for upstream point sources, we might be imposing real costs on Ames, Story City, and Nevada without achieving real benefits for Oskaloosa.
I am also concerned that disallowing the 10% binomial rule might lead to further politicization of funding for water monitoring. Water quality in rivers is highly variable, and daily or weekly monitoring might pick up on a short-term spike in nitrate that is missed by monthly monitoring. If a single sample can trigger impairment but there are no rules on how often a site has to be monitored, cutting budgets for monitoring programs becomes a tempting way to evade regulation and controversy.
“But look, you found the notice didn’t you?” “Yes,” said Arthur, “yes I did. It was on display in the bottom of a locked filing cabinet stuck in a disused lavatory with a sign on the door saying Beware of the Leopard.”
– Douglas Adams, The Hitchhiker’s Guide to the Galaxy
I was reminded of this scene after spending a long day cross-referencing the Raccoon River TMDL (a pollution budget for nitrate and E. coli) with permits and monitoring data for wastewater treatment plants. In this case, I suspected that polluters were getting away with something, but I’ve had just as much trouble finding information when I wanted to document a success story.
Effluent limits for nitrogen are not strict. Wastewater treatment plants and meatpacking plants in the Raccoon River watershed routinely discharge treated wastewater with nitrate 4-6x the drinking water standard. Why is this allowed? The 2008 Raccoon River TMDL capped pollution from point sources at the existing level, rather than calling for reductions. Due to limited data, the wasteload allocations were an over-estimate, assuming maximum flow and no removal during treatment.
That’s all above board, but someone else at the DNR went a step further. Wasteload allocations in the TMDL were further inflated by a factor of two or three to arrive at effluent limits in the permits, using a procedure justified in an obscure interdepartmental memo. The limits are expressed as total Kjeldahl nitrogen, even though the authors of the TMDL made it clear that other forms of nitrogen are readily converted to nitrate during treatment and in the river. In short, the limits in the permit allow more nitrogen to be discharged than normally comes in with the raw sewage!
For example:
The Storm Lake sewage treatment plant has an effluent limit of 2,052 lbs/day total Kjeldahl nitrogen (30-day avg). Total Kjeldahl nitrogen in the raw sewage is around 1000 lbs/day.
The Tyson meatpacking plant in Storm Lake has an effluent limit of 6,194 lbs/day total Kjeldahl nitrogen (30-day avg). Total Kjeldahl nitrogen in the raw influent is around 4,000 lbs/day.
I also checked a permit affected by the (now withdrawn) Cedar River TMDL. Same story. The Cedar Falls sewage treatment plant has an effluent limit of 1,303 lbs/day total nitrogen (30-day avg). Average total nitrogen in the raw sewage is between 1000-1500 lbs/day.
Confused about the units? That may be deliberate. Total Kjeldahl nitrogen includes ammonia and nitrogen in organic matter. Nitrogen in raw sewage is mostly in these forms, which need to converted to nitrate or removed with the sludge in order to meet other limits and avoid killing fish. Nitrogen in treated effluent is mostly in the form of nitrate. At the Tyson plant, the effluent leaving the plant has around 78 mg/L nitrate, versus 4 mg/L TKN, but figuring that out required several calculations. At smaller plants, the data to calculate nitrate pollution isn’t even collected.
As part of the Iowa Nutrient Reduction Strategy, large point source polluters are supposed to evaluate the feasibility of reducing nitrate to 10 mg/L, and phosphorus to 1 mg/L. Tyson did a feasibility study for phosphorus removal, and is now adding new treatment to its Storm Lake plant. However, it is not required to evaluate or implement further nitrogen reduction, “because it is already subject to a technology-based limit from the ELG.” This federal Effluent Limitation Guideline was challenged in court by environmental groups this year, and is now being revised by the EPA. It allows meatpacking plants to discharge a daily maximum of 194 mg/L total nitrogen!
Fortunately, all this creative permitting has little impact on the cost and safety of drinking water in the Des Moines metro. According to research in the TMDL, point sources only account for about 10% of the nitrogen load, on days when nitrate in the Raccoon River exceeds the drinking water standard. However, the figure is much higher (30%) for the North Raccoon River. I started looking at permits and effluent monitoring because I was trying to explain some unusual data from nitrate sensors, brought to my attention by friends with the Raccoon River Watershed Association. During a fall with very little rain (less than 0.04 inches in November at Storm Lake), nitrate in the North Raccoon River near Sac City remained very high (8 to 11 mg/L). The two largest point sources upstream of that site can easily account for half the nitrogen load during that period.
I was glad to be able to solve a mystery, and hope that this investigation can lead to some tools and teaching materials to help others identify when and where point sources could be influencing rivers. The load-duration curves in the 200-page Raccoon River TMDL are very good, but some people might benefit from something simpler, like this table. In general, the bigger the facility, the smaller the river, and the drier the weather, the more point sources of pollution can influence water quality, and the more wastewater treatment projects can make a difference.
I made this table to estimate how biological nutrient removal in Nevada and Oskaloosa (about 1 MGD each) could improve water quality in the South Skunk River (about 1000 cfs on average near Oskaloosa, but there could be greater benefit in tributaries, or when rivers are lower).
In this work, I’m supported by partners around the state and a grant from the Water Foundation. The project (Movement Infrastructure for Clean Water in Iowa) focuses on building connections and shared tools around water monitoring, and will continue through this spring and summer. The funders’ interest is in helping the environmental movement make the most of the “once-in-generation opportunity” presented by the Inflation Reduction Act and the Bipartisan Infrastructure Law. This fiscal year, the Bipartisan Infrastructure Law is adding $28 million to Iowa’s Clean Water State Revolving Fund, which provides low-interest loans to communities to replace aging sewer systems and treatment plants. Can that infrastructure spending help Iowa’s polluted rivers? We won’t know for sure without better use of water quality data, and greater transparency in state government.
 (1)")