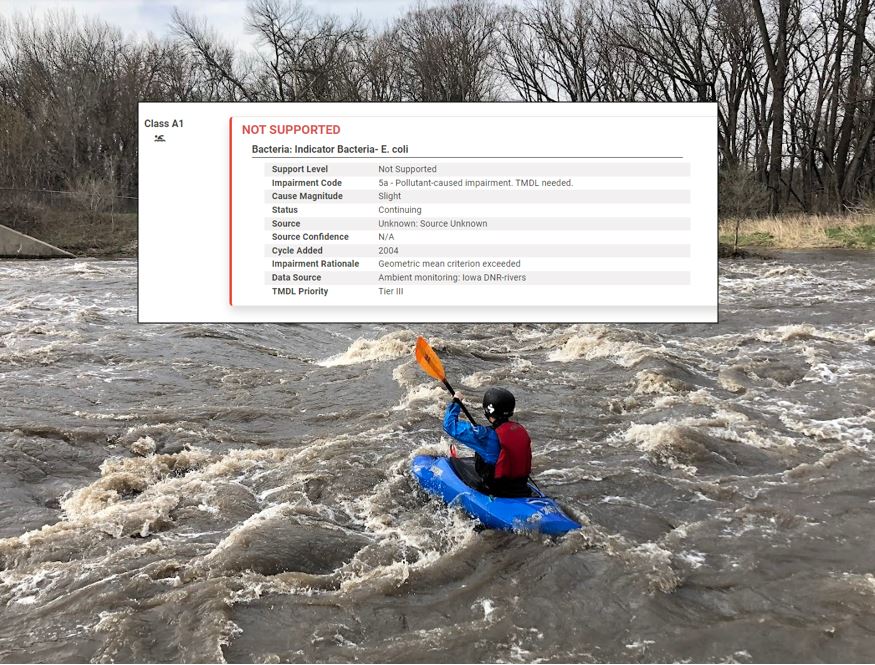
For safety’s sake, I wish people would not mix boats and alcohol, but I’m writing about the other type of impairment that can get in way of having a fun and safe experience on Iowa’s lakes and rivers: water quality. Every two years, the Iowa Department of Natural Resources takes stock of which lakes and rivers have water quality good enough to fully support recreation, fishing, drinking water supply, and other beneficial uses. Those that don’t go on the Impaired Waters List. The draft 2024 Impaired Waters List has been published and you can make public comment through April 12.
Understanding the numbers
Most of the op-eds and news stories about the impaired waters list focus on the numbers. There are 572 rivers and streams, 137 lakes, and 12 wetlands on the impaired list. If you had forgotten that Iowa has water quality problems, here’s your biennial reminder!
This year, there are fewer impaired waters than in the 2022 cycle. Much will be made of that, and will be much ado about nothing. The Impaired Waters List is not very useful for evaluating water quality trends, because the number of waters assessed and the methodology used to assess them is always changing. It’s also worth noting that the assessment period (2020-2022) included long stretches of drought, which means less runoff, so it’s possible that some of the 97 waters removed from the list will go back on the impaired list when we get some wetter weather.
Missing data
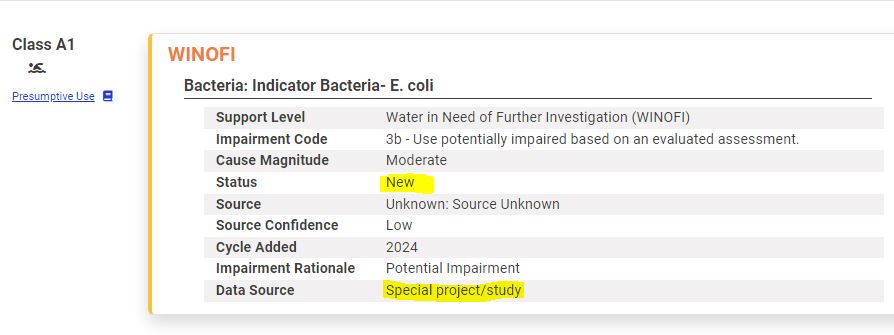
Not too long ago, the biggest category in the integrated report was waters not assessed. This year, it has dropped to 49% of rivers, 44% of lakes, and 21% of wetlands. We can claim a little bit of credit for this. Eight stream segments formerly in the not assessed category were tested for E. coli as part of the Story County water monitoring program and are now in a category called Waters in Need of Further Investigation (WINOFI). There’s a state law that prevents IDNR from using third-party data for regulatory decisions, but I still appreciate that they reached out and included our data in the report!
Finding clean waters
I’m most interested in which waters are impaired and why. For rivers, the leading cause of impairment is E. coli bacteria, an indicator of fecal contamination and a proxy for other pathogens that could potentially make people sick if they swallow some water while recreating.
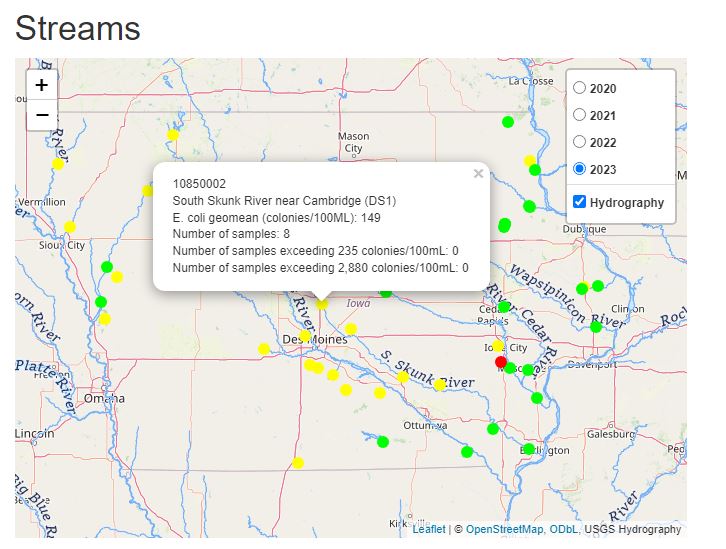
I am sometimes asked where to go in Iowa to find clean water for paddling, swimming, floating in an inner tube, or just letting the kids splash and catch crayfish in the creek. A map or list of impaired waters is not very helpful for this, because the waters that aren’t included might be clean, or they might not have been assessed. So I made an interactive map, color-coded to show which lakes and rivers met or exceeded the primary and secondary contact recreation standards, in the last four recreational seasons. Hopefully this a just a prototype for something even better and more comprehensive.
Improving Impaired Waters
We don’t want to just avoid the impaired waters, we want to know how to clean them up. The Impaired Waters List is also a waiting list for a water quality improvement plan, or Total Maximum Daily Load (TMDL). IDNR has studied swimming beaches at several lakes (including Hickory Grove Lake in Story County), and found that E. coli is highest in the wet sand at the beach, and lower in the lake and tributaries. For these lakes, that suggests that the biggest sources of contamination are located at the beach, things like geese and diaper malfunctions. For rivers impaired by E. coli, we don’t know the cause. Many rivers have been waiting decades for a TMDL in a low priority tier, and a TMDL that was written in 2017 for the Iowa River seemed incomplete.
However, after attending the Raccoon River Watershed Association’s annual conference on March 9, I no longer feel like Iowa has given up on recreational water quality in rivers. Robin Fortney shared reminiscences of many river trips. Jon Wenck (IDNR) and Pat Boddy (ICON) talked about Iowa’s growing network of water trails. It’s clear there are people who care about our rivers and see how they can benefit quality of life and economic development. Claire Hruby (Drake University) shared some early results from microbial source tracking and microbial risk assessment research in Polk County. With these approaches, can find out which pathogens are present in the water (not as many as we feared) and whether waste is coming from livestock, wildlife, or humans or a combination!
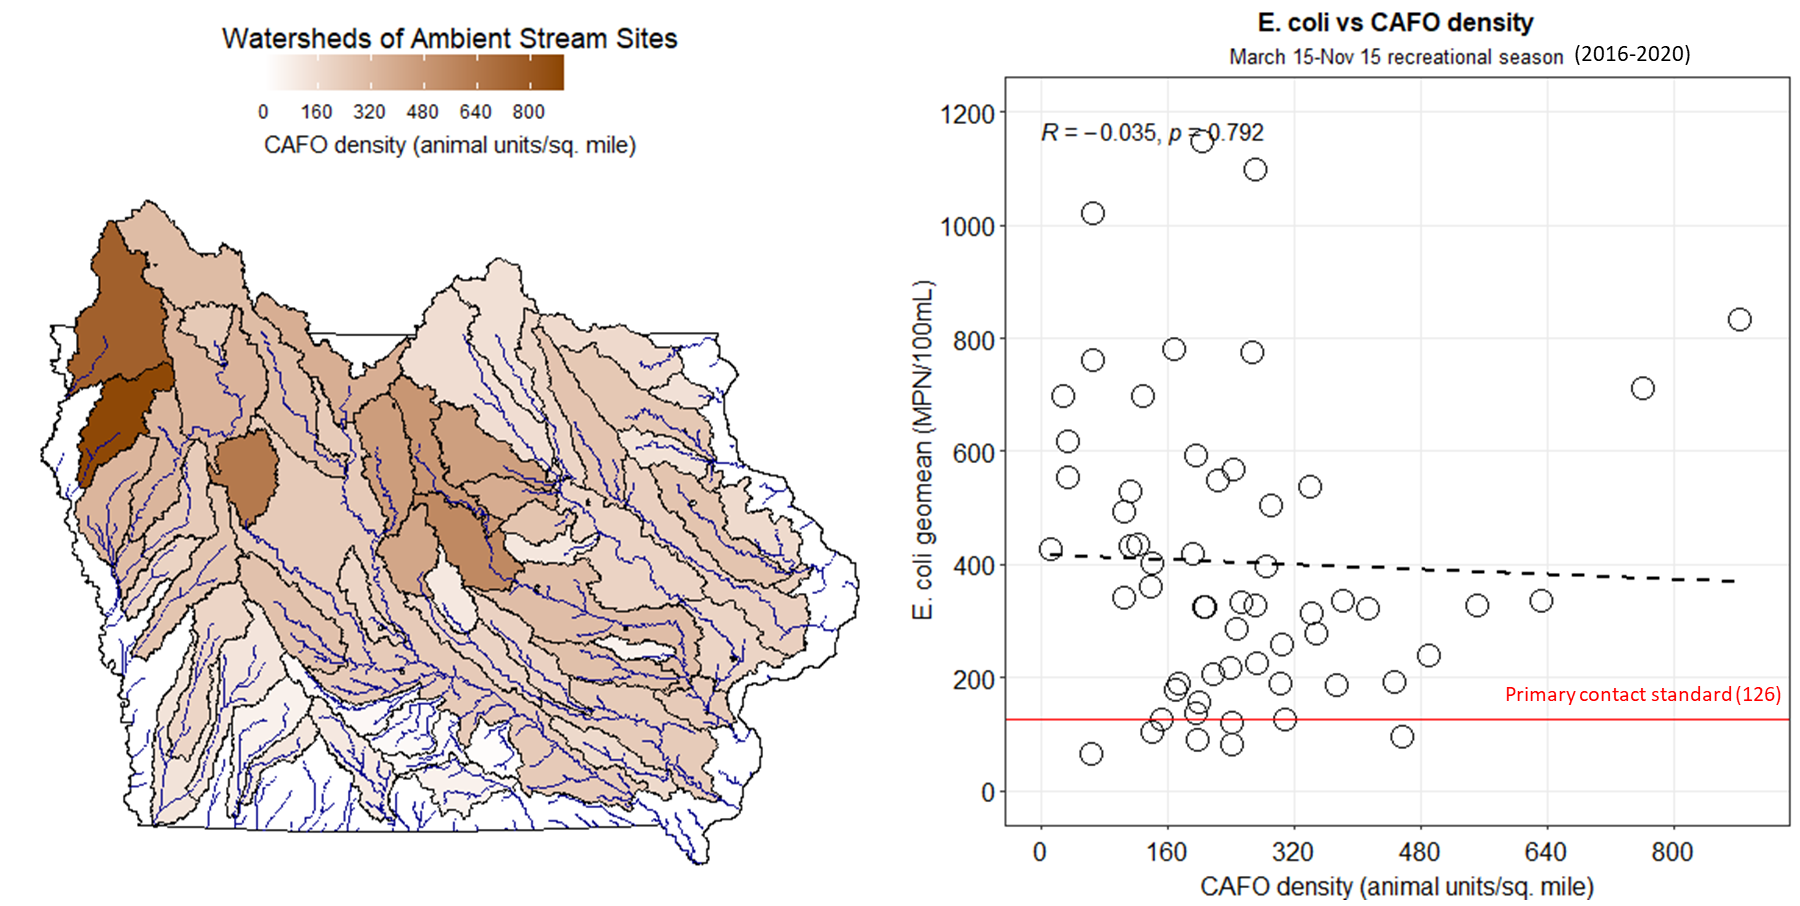
My contribution to the conference was a nuanced look at exactly how CAFOs (big feedlots) impact water quality. I hope to share a video of the presentation and a report in our April newsletter. There are far too many spills and leaking manure storage structures, and manure management plans don’t prevent over-application of nitrogen and phosphorus. However, the claim that waste from factory farms is responsible for most of Iowa’s impaired waters is just not supported by the data. Here is one figure from my presentation. Notice that Iowa has many rivers with extremely high E. coli levels but fairly low livestock densities in the watershed. To understand E. coli contamination, you have to consider not just the amount of feces produced, but how it likely it is that feces will reach the water before the bacteria die off.
The Fine Print
If you explore the Impaired Waters List and the rest of the assessment database, you will likely run across some things that don’t make sense. I share your frustration! This pair of short videos from our “Clean Water Act: 50 Years, 50 Facts” series contrasts how Section 305(b) and 303(d) of the Clean Water Act should work in theory, and how it can go wrong in practice. However, I continue to see improvements in the assessment database (ADBNet) and water quality database (AQuIA) and want to express my appreciation to IDNR for the data they collect and their efforts to be make it available to the public.

