Our grant from the Water Foundation gave me an excuse to dive deep into a big statewide dataset collected by the Iowa DNR. I presented some of that analysis (along with general tips for data analysis) at the Iowa Water Summit in October. Since my slides rarely make sense without the narration, I have also written up a series of set of three case studies about trend monitoring.
I started learning R, a computer programming language for data science and statistics, in 2020. There was a steep learning curve, but now I get to coast downhill. If I can make an interactive map to display which chloride and phosphate readings from a volunteer event fall into the “good” category, I can reuse a lot of that code to make another interactive map that shows which lakes meet the recreation standard for E. coli. If I can figure out how to overlay maps of watersheds and animal feeding operations to calculate livestock density for 60 monitoring sites, it’s not hard to adapt that to calculate a similar metric for wastewater treatment plants. If I can make a good graph for one site, it’s not hard to scale that up to 50 sites.
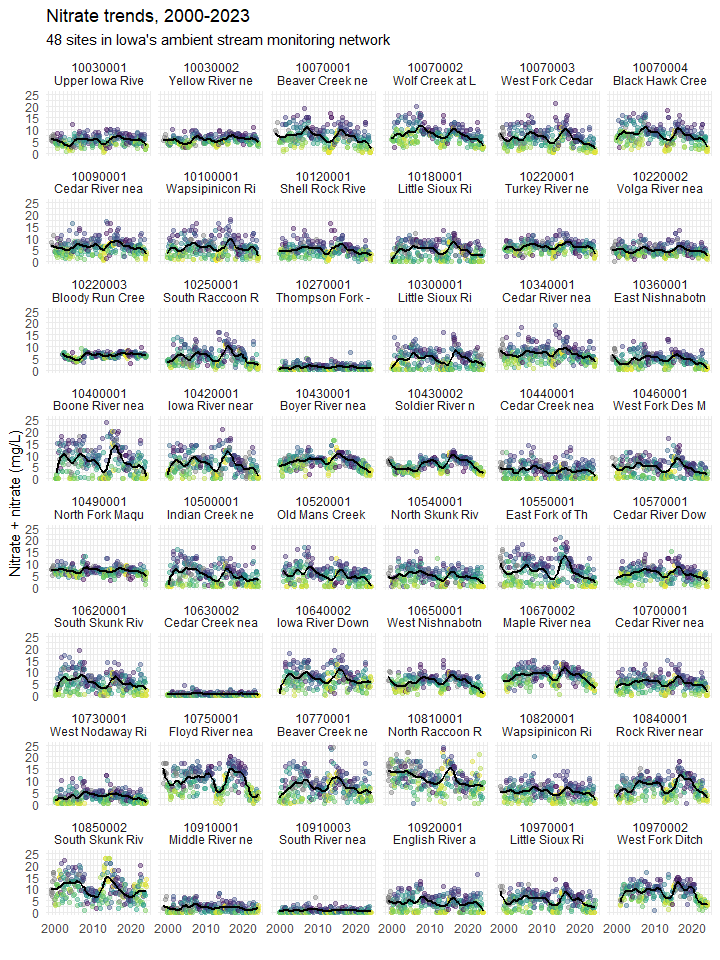
Behold! My finest graph yet! On a single page, you can see 20 years of monthly nitrate data for the 48 sites in Iowa’s Ambient Stream Monitoring network with the longest record. The dots are color-coded to show streamflow at the nearest gage on the day the water samples were collected, yellow when water levels were at their lowest and grading to purple when water levels were at their highest. The black line is a 3-year moving average (or at least a close approximation with LOESS). You’ll notice that nitrate levels in most streams shot up sometime around 2014 and have been declining since. But how much of that is a precipitation-related trend tied to the El Niño-Southern Oscillation and how much is due to conservation efforts in the watershed?
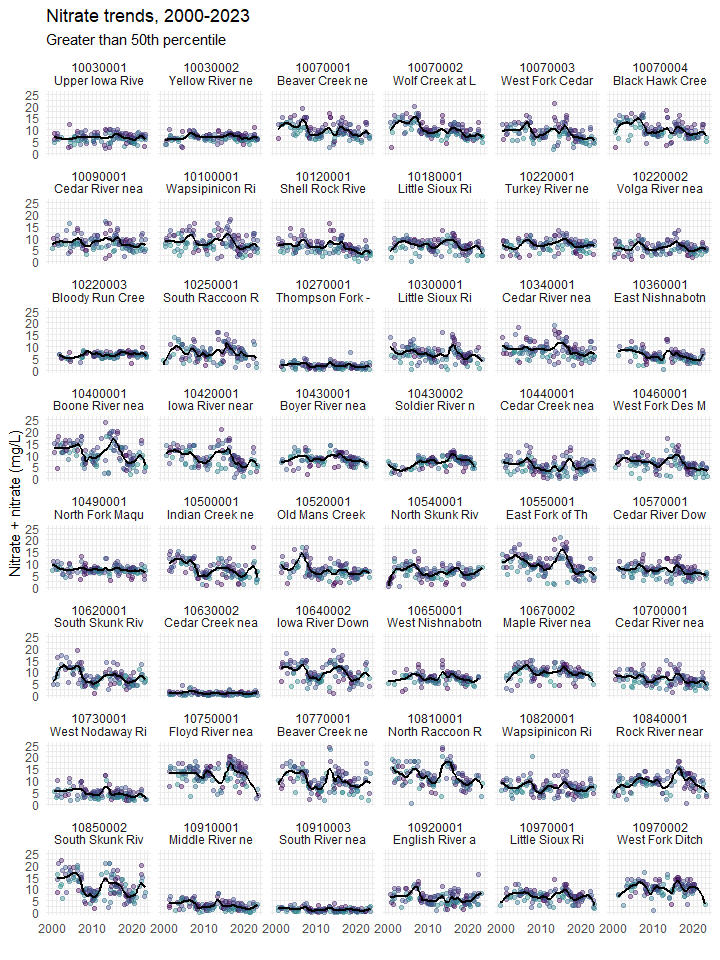
Here comes the magic trick! Watch closely, for when I place into my hat all those samples collected when streamflow was lower than average (yellow and green dots) some of these apparent nitrate trends will…. disappear!
Darn it, that didn’t work at all! For the third of three case studies I’ll link to below, I take a closer look at two of these sites: Black Hawk Creek, where I’d expect a moderate improvement based on cover crop acreage and the East Fork of the Des Moines River, where I’d expect very little improvement. The East Fork actually has a much bigger nitrate trend than Black Hawk Creek and I can’t account for it. Maybe I should give up and leave trend monitoring to the experts at Iowa State University and Iowa DNR, they seem to know what they’re doing (see Danalatos et al. 2022).
However, the trick did work when I compared a watershed impacted by mostly point sources of pollution (i.e. sewage treatment plants) to a watershed impacted by mostly non-point source pollution (i.e. agricultural runoff). This is the first of the three case studies. Phosphorus concentrations have increased in the North Raccoon River and decreased in the South Raccoon has decreased, but that’s entirely due to recent drought. The second case study introduces a new metric for identifying rivers that a strongly influenced by point source pollution, and how to track improvement.
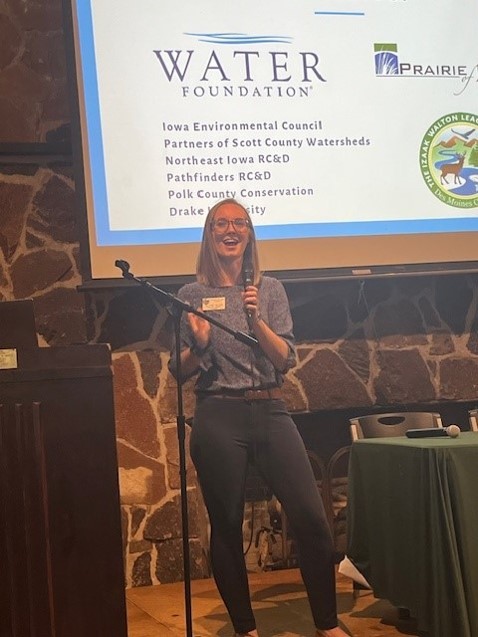
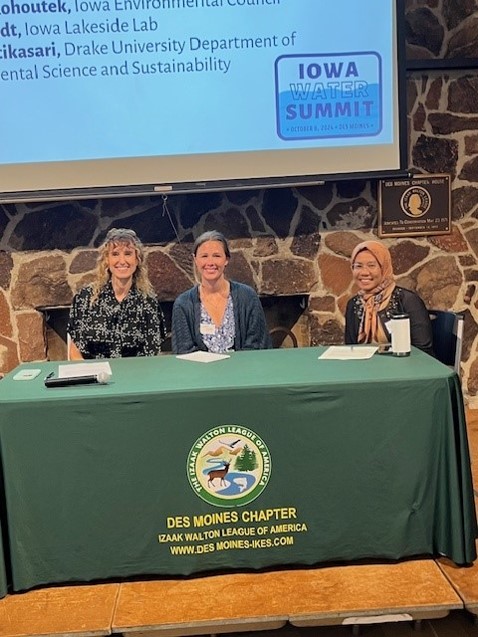
The Iowa Water Summit on October 8 brought together 65 people with an interest in water monitoring for a day of learning and networking. The event was one outcome of the grant from the Water Foundation that Prairie Rivers of Iowa was awarded last year and the regular meetings we’ve been having with seven partner organizations. The Des Moines Chapter of the Izaak Walton League made their facilities available and Heather Wilson (Midwest Save Our Streams Coordinator for the Ikes) did the lion’s share of the planning. Thanks to our presenters, to Bud Hartley for taking these photos, and everyone who helped make the event possible!
Planning events, dipping test strips, identifying and counting benthic macroinvertebrates, shocking fish, incubating bacterial plates, calibrating equipment, maintaining databases, analyzing data, communicating with the public… There’s a lot of work that goes into finding out what’s in our lakes, rivers, and streams! Between the Water Summit and my 8 years (!) working for Prairie Rivers of Iowa, I’m starting to assemble a picture of the organizations that do water monitoring and where to find the data they collect. Even so, this will not be a complete list! Feel free to add some more in the comments!
State and federal agencies
State and federal environmental agencies do a lot of water monitoring and have a lot of expertise, so if you’re looking for data, your first stop should be one of these databases.
BioNet houses fish and macroinvertebrate surveys collected by the Iowa Department of Natural Resources and the State Hygienic Lab. If you want to know which streams support stoneflies or whether biological diversity has declined in a certain creek, this is the place to find out.
How’s My Waterway is a convenient way to access data submitted to the Environmental Protection Agency from both state and local partners. For example, IDNR uploads their data once a year, while Polk County Conservation uploads their data once a month. EPA’s old system was called STORET, but now it’s the Water Quality Portal for downloads and the Water Quality Exchange for uploads.
The National Water Dashboard provides access to the US Geologic Survey’s network of stream gages, essential information if you live on a floodplain, if you’re planning a canoe trip, or if you need some context to make sense of your water quality data. The USGS also does quite a bit of water quality monitoring, in partnership with the EPA—the National Rivers and Streams Assessment is the best water quality study you’ve never heard of.
Volunteer programs
Iowa has too many waterways for the agencies to monitor on a regular basis, so if you want to know about water quality in your local creek, you may have to do it yourself. Fortunately, since the end of the IOWATER program, other organizations have stepped up to provide volunteers with equipment, training, and a place to store the data.
Polk County Conservation has a very impressive monitoring program, based on the IOWATER protocols, with data housed on the EPA’s Water Quality Portal. Staff, partners and public volunteers monitor 70 sites twice a month. Partners include Des Moines Water Works, the Cities of Altoona, Ankeny, Des Moines, and West Des Moines along with Des Moines Parks and Recreations and West Des Moines Parks and Recreation.
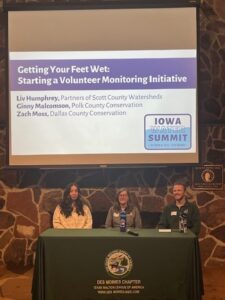
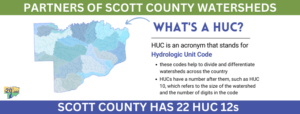
Partners of Scott County Watersheds is one of several organizations with a watershed or regional focus that organize big volunteer monitoring events (snapshots) two or three times a year. They have created their own database and online dashboard to view the results.
Trout Unlimited has been encouraging anglers in the driftless area to monitor water quality with a test strip and mobile app.
Watershed Projects and Agriculture
Prairie Rivers of Iowa originally got involved in water monitoring to educate the public about the Ioway Creek watershed and track conservation efforts in that watershed. Many watershed projects incorporate water monitoring for one or both of those reasons. A typical approach is to collect water samples once or twice a month during the growing season (plus some samples after heavy rains) and send them to a certified lab for analysis. In our case, that’s a lab operated by the City of Ames water and pollution control department, but others watershed projects have partnered with a university or commercial lab.
Have you seen “Moved by Waters?” The documentary by Fourth Wall Films showcases the conservation, education, and citizen science work that Partners of Scott County Watersheds is doing in the Quad Cities and surrounding farmland. In addition to snapshot events they have a long history of research to try to track down sources of bacteria. Our grant helped them do one more round of microbial source tracking; Vice-Chair Steve Gustafson shared preliminary findings at the Water Summit but it wasn’t straightforward!
The Iowa Soybean Association has supported nutrient sampling of streams and drainage tiles for some 19 watershed projects around the state. The Lower Skunk River WQI project is a good example of that—Pathfinders RC&D collects water samples that are sent to the Iowa Soybean Association for laboratory analysis. Several soil and water conservation districts and agribusiness groups are also partners on the project. Since the ISA collects many field edge samples that come with some privacy concerns, they don’t have a publicly accessible database. However…
Agriculture’s Clean Water Alliance has worked with ISA to monitor nitrate in the Raccoon River, Boone River, and Beaver Creek watersheds. They post annual reports going back decades.
Northeast Iowa RC&D has been coordinating water quality monitoring in the driftless area for 25 years, as described in this article. They have created a nice data dashboard for the Upper Iowa River watershed and the Upper Wapsipinicon River watershed.
Colleges and Universities
The Iowa Water Quality Information System is an amazing map that shows you real-time data from a network of nitrate sensors operated by IIHR (Hydroscience and Engineering at the University of Iowa) and the USGS.
Marty St. Clair (formerly of Coe College, now at University of Iowa) and his students have done sampling and laboratory analysis to support the Middle Cedar River, Indian Creek, Upper Iowa, Turkey River, Maquoketa River, and Upper Wapsipinicon River Watershed Management Authorities.
Drake University’s environmental science department has done stream monitoring to support watershed projects and water recreation in Polk County. It’s often a challenge to maintain access to data that’s collected for student projects, but a solution is in the works.
Iowa State University researchers have done a lot of the field scale and edge-of-field monitoring that established the effectiveness of conservation practices including riparian buffers, saturated buffers, bioreactors, and CREP wetlands. ISU is also responsible for tracking various progress indicators for the Iowa Nutrient Reduction Strategy, including compiling water quality data from IIHR, DNR, and USGS.
Closing Thoughts
Finally, there are organizations that don’t collect data themselves, but help make the other data more accessible to the public. The Iowa Environmental Council sends out a Weekly Water Watch newsletter to provide updates on beach monitoring by Iowa DNR, and they’ve been advocating for standardized, easily accessible, user-friendly data.
That’s an idea I support, and there are people working toward an “Internet of Water.” However, I am a bit skeptical when I hear people say “why don’t you use AI” or “you should really get all this data in one place.” Have you ever tried downloading data from the EPA’s Water Quality Portal that was sourced from more than one organization? I have, and I eventually got something useful out of it, but first I had to delete 20 unused columns and then I had to shorten the column names and then I had to clean up the non-numeric entries that one organization had put in a numeric field, and then I had to filter out the sites where monitoring too sporadic to be representative. Bigger, more flexible systems have their drawbacks.
I am more excited about building relationships and improving communication among the various people who care about water quality and who are involved in monitoring, so we can learn from each other and avoid duplication of effort. Hopefully, the Iowa Water Summit and this article are a step in that direction!
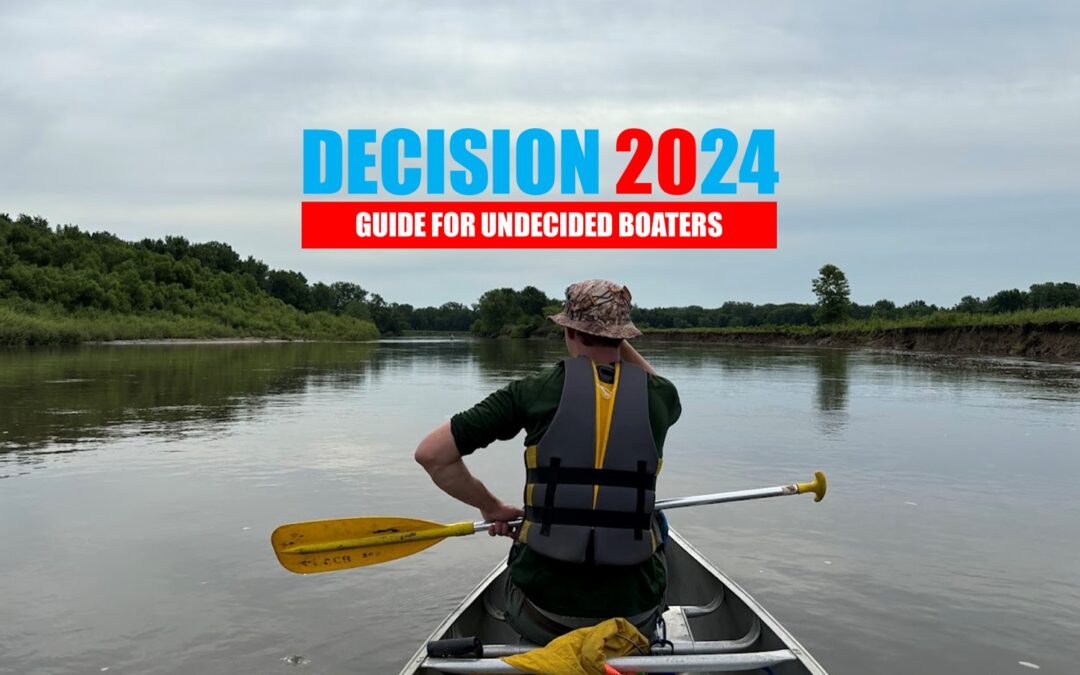
It should go without saying that there are decisions on the ballot that will affect the environment, but if you need a break from election news and commentary, read this Undecided Boater Guide for some low-stakes environmental education and take an opportunity to lower your stress levels by getting out into nature!
Left or Right?
Following the deepest, swiftest part of the river can be a good way to avoid obstructions, but you can’t do that by staying in the center. You have to go with the flow. When a river bends, the water has to travel faster on the outside of the bend, and that water can carry more sediment, producing a cut bank on the outside and a sandbar on the inside. My canoeing partner on Project A.W.A.R.E. gave me a good tip for following the thalweg, or deepest line of the river–look for a line of bubbles and fast moving debris. What, you thought I was making a political allegory? Nah, I just like canoeing!
In or Out?
The first question for the undecided boater is whether to get in the water! After hearing enough stories about brain-eating amoebas and toxic algae blooms, some people are afraid to go in any Iowa lake or river, any time, while others start to tune it alll out and proceed with their plans regardless of how the water looks, smells, or tests. I think we can enjoy Iowa’s lakes and rivers while taking some reasonable precautions. As our data analysis shows, some water bodies in Iowa are cleaner than others. Subscribe to Iowa Environmental Council’s Water Watch newsletter to get updates on beach advisories, and as a rule of thumb, stay out of water that looks like green paint. Minimize your exposure to pathogens by keeping your head out of water, and washing your hands (or applying sanitizer) before eating.
The Lesser of Two Weevils
“Living under a rock for the past few years” is a figure of speech sometimes applied to undecided voters, but for stoneflies, it’s literally true! By coincidence, I organized a group of volunteers to do a biological monitoring session in Ioway Creek during the weeks leading up the both the 2020 and 2024 elections, and we caught stoneflies in our net both times. The stoneflies we caught in 2024 were almost too big to fit in the ice cube tray we use for sorting and counting insects, and had finely branched gills that look like hairy armpits. The stoneflies we caught in 2020 were a fraction of the size and had no visible gills. After looking at specimens under a microscope and consulting a guidebook, I determined they are different species with different policies. The giant stonefly (Pteronarcys sp.) escapes predators by squirting blood out of pores on its leg joints. The small winter stonefly (Allocapnia sp.) escapes predators by producing a sort of natural anti-freeze and emerging from the water to mate when there is snow on the ground! However, both families of stonefly are shredders (eating dead leaves) and both are sensitive to poor water quality. I think that’s not a real choice and am writing in “dragonflies” as a protest.
Turtles offer a clearer contrast. The spiny softshell is aggressive and has a painful bite. The smooth softshell, less so. During a nature program at project AWARE, Denny Weiss demonstrated how to hold a softshell turtle to tell the difference while staying out of range!
Closing thoughts
This election year included several first time water experiences for me: digging up mussels in the Wapsipinicon River for Scott Gritter’s Mussel Blitz, paddling and cleaning up trash as part of Iowa Project A.W.A.R.E., and going stand-up-paddling in Clear Lake with my family. Even a familiar location can hold surprises; I did not realize there were smallmouth bass in Ioway Creek until just a few weeks ago, when I saw a teenager catch one at Brookside Park on a fly rod. Undecided boaters should be aware that even in a state with many environmental challenges, there is a lot to enjoy and explore!
For 18 years, staff with the Iowa Department of Natural Resources trained and equipped volunteers to test water quality in rivers and streams across the state, building a network of citizen scientists and conservation leaders in the process. The IOWATER program died in 2016 after a long battle with budget cuts, declining participation, and IT challenges. It is survived by the state’s largest river cleanup event (Iowa Project A.W.A.R.E.) and many volunteers who resumed or started monitoring with the support of the Izaak Walton League, county conservation departments, watershed coalitions, and local non-profits.
The first Iowa Water Summit in 2019 was a sort of a funeral for the IOWATER program and a passing of the torch to the Izaak Walton League’s Save Our Streams program. Several groups in Iowa are making good use of the Ikes’ online database, trainers and training materials, and extra supplies. However, stream monitoring in the post-IOWATER era is decentralized and locally-led. Prairie Rivers of Iowa thought we could all benefit from more collaboration, so we wrote a grant proposal that was funded by the Water Foundation. Over the past year, I’ve been meeting regularly with colleagues from the Iowa Environmental Council, Northeast Iowa RC&D, Pathfinders RC&D, Partners of Scott County Watersheds, Polk County Conservation, and Drake University to talk about water monitoring, lay the groundwork for some new tools, and help the Izaak Walton League plan a second Water Summit.
The second Iowa Water Summit (scheduled for Oct 8 in Des Moines) is an opportunity for anyone involved in a local monitoring program (or looking to start one) to come together and learn from the experience of others around the state. We’ll have time and space for displays and networking. We’ll have a panel about recruiting and retaining volunteers. We’ll have a talk about making sense of the data once you have it, and another about new methods like microbial source tracking. We’ll have a panel about communicating with the public and turning data into action. If you’re at all interested in water quality and water monitoring in Iowa, don’t be shy! Register before September 20!
The other legacy of IOWATER is less trash in our rivers. Iowa Project A.W.A.R.E. was started in 2003 by IOWATER coordinator Brian Soenen, who now serves on the board of a non-profit that continues the tradition. This year, 269 volunteers in canoes removed and recycled 3.8 tons of trash from 60.2 miles of the Skunk River.
This was my first year participating in the cleanup and I highly recommend it! In addition to the fun of being on the water and the satisfaction of leaving the river cleaner than you found it, I enjoyed good food, friendly people, and interesting evening nature programs, including live turtles and a dugout canoe!
A.W.A.R.E. stands for A Watershed Awareness River Experience, and I tried to raise some watershed awareness in my Monday afternoon talk about the hydrology and water quality of the Skunk River. For example:
The Skunk River starts near Blairsburg and joins the Mississippi River near Burlington after a journey of 274 miles. By that point, it drains more than 4000 square miles of central and southeastern Iowa.
Thunderstorms in the Ames area lead to a rise in water levels at Augusta eight days later.
Rain that falls in the watershed can reach streams quickly if it runs off the surface or travels through storm sewers or drainage tiles, but moves more slowly if it’s caught by ponds and wetlands or soaks into the ground. Some of the water entering Ada Hayden Lake in Ames showed chemical signatures of having been underground for more than 50 years!
Watershed characteristics can help explain water quality patterns in the Skunk River and its tributaries, as shown in this table. For example:
The North Skunk River watershed has steeper hills, so has higher turbidity levels. The South Skunk River watershed is flatter with more tile-drained cropland, so has higher nitrate.
The Skunk River receives effluent from 9 major wastewater treatment plants (Ames, Newton, Nevada, Mt. Pleasant, Grinnell, Fairfield, Oskaloosa, Washington and Montezuma) and 85 smaller systems, which contribute to higher phosphorus levels.
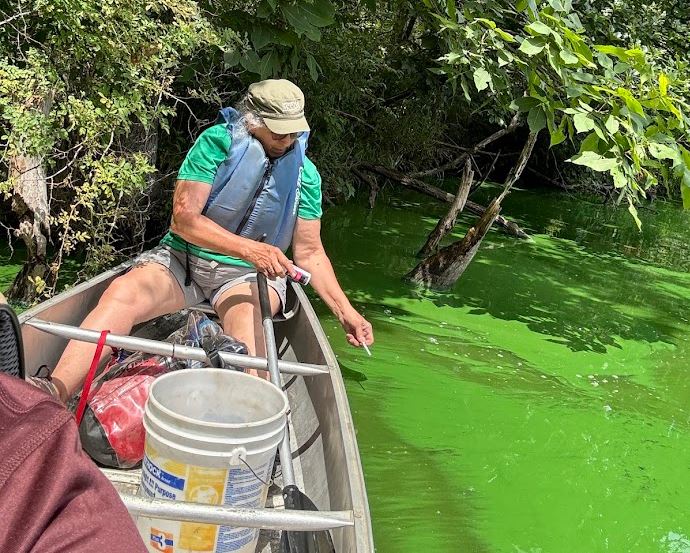
However, the most memorable and sobering lesson about watersheds was taught by Lake Darling. We camped three nights at the state park, and I had an opportunity to explore it on Monday when high water levels kept us off the river. Lake Darling State Park has a lot going for it: a large lake in a beautiful setting, with an active Friends group that has improved trails and facilities. But the water quality is appalling. During my visit, the beach had a warning sign posted due to high levels of microcystin (a toxin produced by blue-green algae). I have never seen water this green. It looked like a kale smoothie and smelled like manure.
What happened? In 2007, Iowa DNR was celebrating Lake Darling as a success story, after most farmers in the watershed participated in a program to control erosion and intercept runoff. A $12 million project to drain and restore the lake was completed in 2014. By every indication, these efforts were successful at reducing the amount of sediment entering the lake. However, other water quality metrics (orthophosphate, E. coli, and microcystin) have gotten worse. The most likely explanation is the manure from 30,000 hogs. Nine animal feeding operations have been built in this watershed since the park reopened. I calculated the density of livestock in Lake Darling’s watershed (598 animal units per square mile) and found that it’s highest of any lake in Iowa, and higher than all but a handful of rivers.
This is why it’s not enough to measure success by dollars of cost share spent or the number of practices installed. We need to be aware of both positive and negative influences on the water bodies that we care about, and we need to test whether water quality is actually improving. At the Iowa Water Summit, I’ll share some tools and tips for doing just that. Hope to see you there!
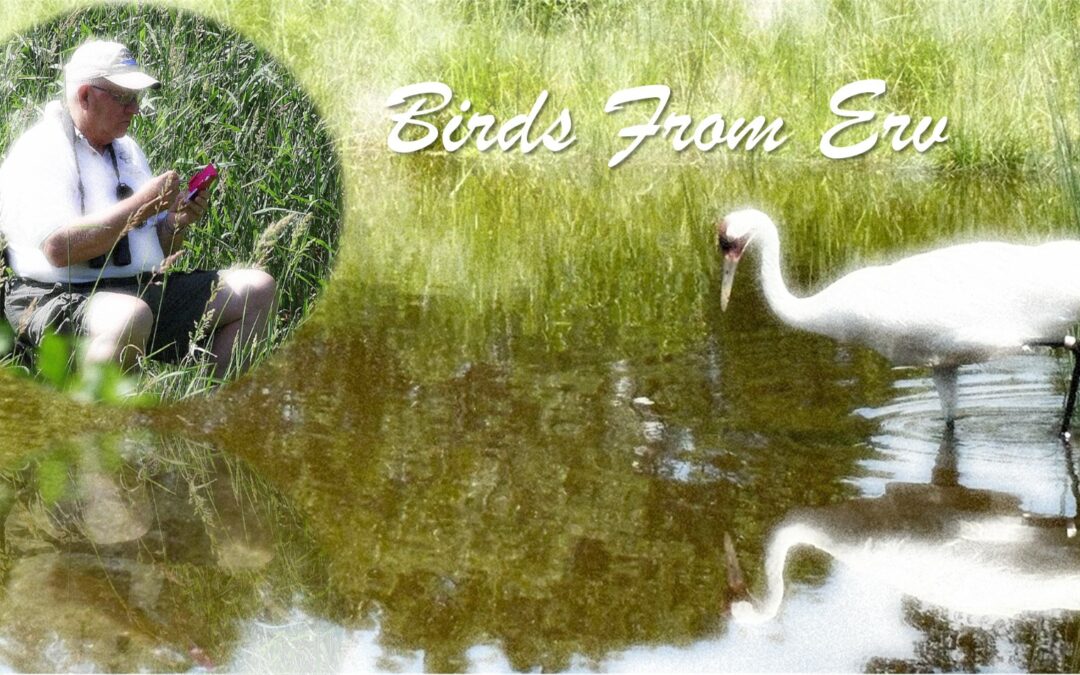
Erwin “Erv” Klaas died on Saturday July 6. His passing is a great loss for Prairie Rivers of Iowa. He served on the board since its founding in 2001, started an endowment for the organization in honor of his wife Janet, and was a reliable presence at our events.
I received the news of his death on Sunday while visiting the International Crane Foundation with my family. We were watching a whooping crane, and my mother immediately recalled a birding trip that Erv had led to Nebraska’s Platte River many years back, perhaps as a contribution for our church’s silent auction. Among the awe-inspiring flocks of thousands of grey-feathered sandhill cranes, Erv had his binoculars trained on a single white-feathered whooping crane and was trying to help the rest of the group spot it. Mom said it was like a page out of “Where’s Waldo!” It’s a fun image to recall a one-of-kind ornithologist who loved sharing his passion for nature with other people.
Let’s think of Erv whenever we raise our binoculars! Here are five other birds (plus one plant and two insects) that remind me of his life and legacy.
Horned Lark (Eremophila alpestris)
Shortly after I was hired, Erv took me for a driving tour of the Ioway Creek watershed. As an assistant commissioner for the Story County Soil & Water Conservation District (and a representative for the group on the Watershed Management Authority), he was well-aware of how some farming practices could degrade soil, water, and wildlife habitat, while other farming practices could preserve them. He pointed out examples of both on our drive. At one point, he told me to pull over so he could take out his binoculars and get a better look at a flock of non-descript birds hopping and fluttering about on the open fields. Up close, they’re adorable! Horned larks are gregarious birds that form large, mixed-species flocks, which could describe Erv too!
Passenger Pigeon (Ectopistes migratorius)
Erv believed that care for the land and its creatures is an ethical imperative. Toward that end, he organized a regular event where residents of Ames and the surrounding area would gather to read passages from Sand County Almanac and other essays by Aldo Leopold. One that I find especially moving is “On a Monument to the Pigeon,” first delivered in 1947, which includes poetic lines like this:
There will always be pigeons in books and in museums, but these are effigies and images, dead to all hardships and to all delights. Book-pigeons cannot dive out of a cloud to make the deer run for cover, or clap their wings in thunderous applause of mast-laden woods. Book-pigeons cannot breakfast on new-mown wheat in Minnesota, and dine on blueberries in Canada. They know no urge of seasons; they feel no kiss of sun, no lash of wind and weather. They live forever by not living at all.
Trumpeter swan (Cygnus buccinator)
The trumpeter swan could have gone the way of the passenger pigeon (there were only 69 birds remaining in the continental US in the 1930s) but the population has made an impressive recovery (63,000 by 2015). Erv is part of that conservation success story: in 1971 he joined the US Fish and Wildlife Service and conducted research on the effects of DDT on birds that helped lead to a national ban in 1973. It’s been a great joy to see large flocks of trumpeter swans on the lake at Ada Hayden Heritage Park, another of Erv’s signature projects. They also like CREP wetlands constructed to improve water quality; that’s where we spotted this one!
Tape grass (Vallisneria americana)
This aquatic plant is an important food source for waterfowl and nursery for fish. It has an amazing pollination strategy, with boat-like male flowers and corkscrew-stemmed female flowers! Anne Kimber (my stepmother) studied this plant for her PhD and remembers Erv’s kindness when she ran into difficulties with the field work. I have similar memories. After some setbacks with a data analysis project, I received a phone call from Erv offering encouragement. He told me that I was a scientist in practice if not in credentials, that my work was important, and encouraged me to seek out collaborators and look for ways to bring it to completion. I took his advice.
Eastern Pondhawk (Erythemis simplicicollis)
This is one of many photos that Erv took of adult dragonflies and damselflies at Ada Hayden Heritage Park, continuing his dedication to science in retirement as a volunteer. The aquatic juveniles showed up in his nets when he surveyed benthic macroinvertebrates for the IOWATER program. He monitored water quality monthly at two sites on Ioway Creek from 2002 to 2015, at one point finding unusual bacteria results that were traced back to a cracked sanitary sewer. The IOWATER program is ended, but Prairie Rivers of Iowa continues to support volunteer water monitoring in Story County and is building tools and relationships to help groups across the state learn more from the data they are collecting.
Greater Yellowlegs (Tringa melanoleuca)
I saw one of these unmistakable shorebirds while paddling on the Skunk River below Ames. It was on its spring migration from the Gulf Coast to the Hudson Bay. They are pretty common now, but could be in trouble as the planet warms. Erv was deeply concerned about the impact of climate change on wildlife, water and people here in Iowa and around the world, and founded the Ames Climate Action Team to nudge the City government toward more aggressive action. It’s a great example of “think globally, act locally.”
While families were tagging monarch butterflies and doing hands-on educational activities at Ada Hayden Heritage Park, I spotted this osprey soaring overhead. The “Monarch Magic” event in 2023 exemplifies what Prairie Rivers of Iowa does best: initiating conversations and building partnerships to do things together that no one organization would have attempted on their own, and educating the public to deepen our connections to the places where we live. Our new pollinator specialist (Katelyn Rinicker) is already working on planning the next one. It’s one way Erv’s legacy lives on, even among people who never met him.


")
")


.")
