Are small towns a big problem for water quality?
Before state wastewater standards went into effect in the 1960s, raw sewage could flow directly to a stream without treatment. Despite the standards, this continues in many areas today. In areas called “unsewered communities,” outdated or poorly functioning septic tanks still allow untreated wastewater into our waters. The Iowa DNR works with these communities to find funding sources and alternative treatment systems and to allow adequate time to upgrade the systems.
Iowa DNR: Rural Community Sewers
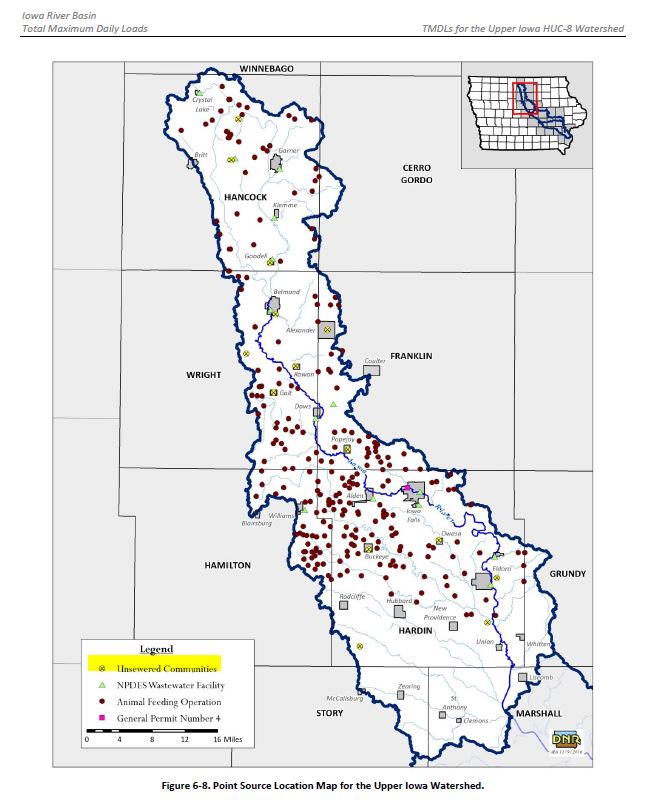
The Governor has announced that additional funding through the infrastructure bill that will be available to help unsewered communities upgrade their systems. Could this make a big difference for water quality in Iowa? Statewide, I’m not sure, but I’ve taken a closer look at the Iowa River Basin upstream of Marshalltown, where we know of 11 unsewered communities. Based on my first look at the data, it appears that these communities have little influence on E. coli in the Iowa River itself, but could make a difference for water quality in tributary streams like Beaver Creek in Hardin County.
A Water Quality Improvement Plan for E. coli bacteria in the Iowa River Basin was released by Iowa DNR in 2017. As required by the Clean Water Act, these kinds of plans include a Total Maximum Daily Load (TMDL) of pollutants that a water body could handle and still meet water quality standards. Author James Hallmark compares this pollution budget to a family budget: regulated point sources are your fixed bills, non-point sources are your variable expenses, and the margin of safety is your emergency fund. I like this analogy and would add that without some understanding of where your discretionary spending is going, and a realistic strategy to reign it in, you’re probably not going to achieve your goals.
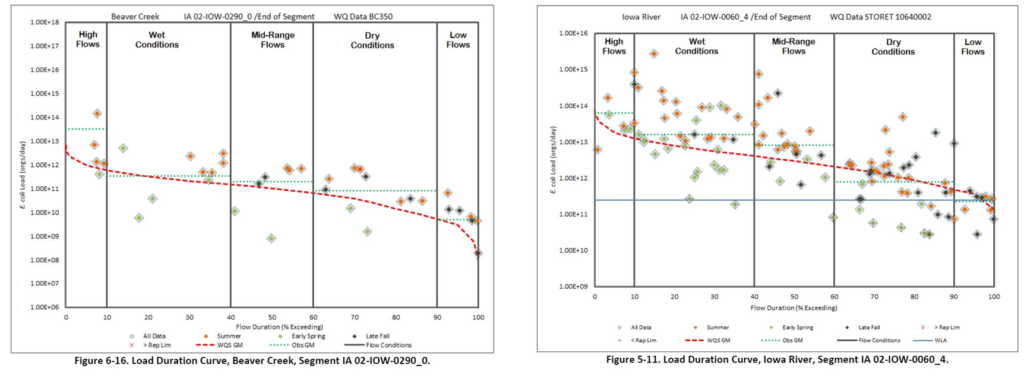
The Water Quality Improvement Plan includes a comprehensive list of E. coli sources but doesn’t single any of them out as being particularly important. It includes a list of potential solutions, but it doesn’t identify which of those would make the most difference. That’s a job for a Watershed Management Plan written with stakeholder input, apparently. However, the document is chock-full of load-duration curves, which I wrote about previously. We can use the information in these charts and tables to take the next step and begin to narrow down where and when the pollution is most serious!
In this article, I won’t pay much attention to “High Flows” and “Low Flows” because there wouldn’t be much recreational use under these conditions. I also don’t look at “mid-range” flows because there’s a bigger mix of sources influencing water quality in these conditions. A closer look at the other two categories is revealing.
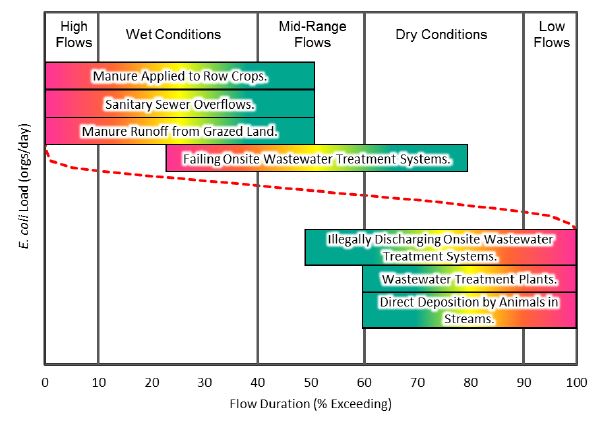
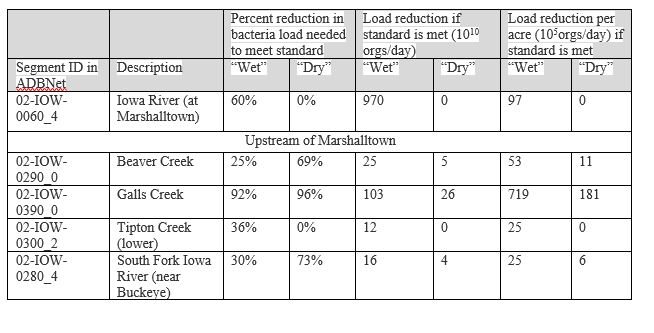
If houses are discharging raw sewage directly into a stream, we’d expect to see the highest E. coli concentrations when the stream is running lower than normal, and there’s less dilution. This is indeed what we see in Beaver Creek in Hardin County, which is downstream from the unsewered community of Owasa. Beaver Creek would need a 79% reduction in E. coli load to meet the primary contact recreation standard during “Dry Conditions” and a 38% reduction during “Wet Conditions”.
Treated sewage also has the biggest influence when streams are lower than usual. The upper reaches of the South Fork receive effluent from the small towns of Williams and Alden, which have waste stabilization lagoons. It’s likely that some bacteria makes it through the treatment process, and this would explain why E. coli is higher during “Dry Conditions” (needing a 73% reduction) than during “Wet Conditions” (needing a 30% reduction). When their permits come up for renewal, Iowa DNR could require a UV disinfection system to ensure that E. coli in effluent is no greater than 126 colonies/100mL.
In a watershed with few people and many hogs, we’d expect to see the highest E. coli concentrations when the streams are running high and runoff from fields that receive manure application is more likely. This is indeed what we see in Tipton Creek in Hardin County, a watershed containing 47(!) CAFOs, but the levels are not especially high compared to other sites in the Iowa River basin. The recreation standard is met during “Dry Conditions” and would need a 36% reduction during “Wet Conditions.” Handled correctly (applied to flat ground at the right time, and preferably incorporated into the soil), manure and the microbes it contains can be kept out of streams. Preventing loss of the nutrients in manure is a more difficult challenge—nitrate concentrations in Tipton Creek often exceed 20 mg/L!

It’s not clear to me whether primary contact recreational use of these streams is a relevant or attainable goal, or whether we should be calibrating our level of concern to the secondary contact recreation criteria. Unless there’s a permit holder affected, IDNR doesn’t investigate whether there’s enough water for kayaking in Tipton Creek, or whether children play in Beaver Creek, so the designated use is presumptive and tells me nothing.
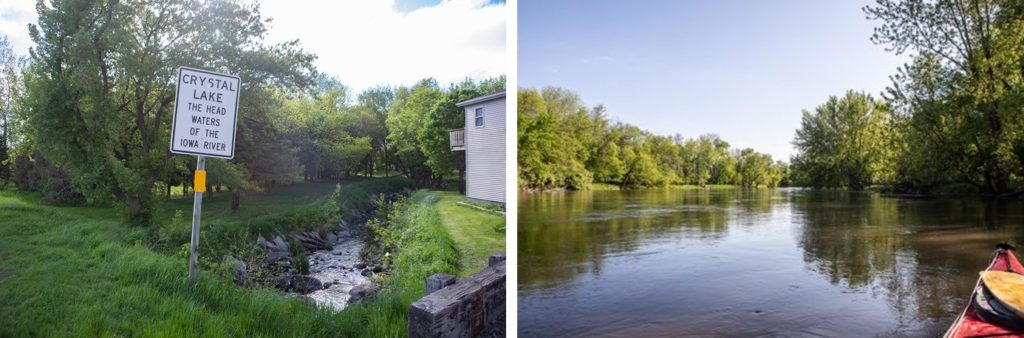
Photo Credits: Ryan Adams, photojournalist
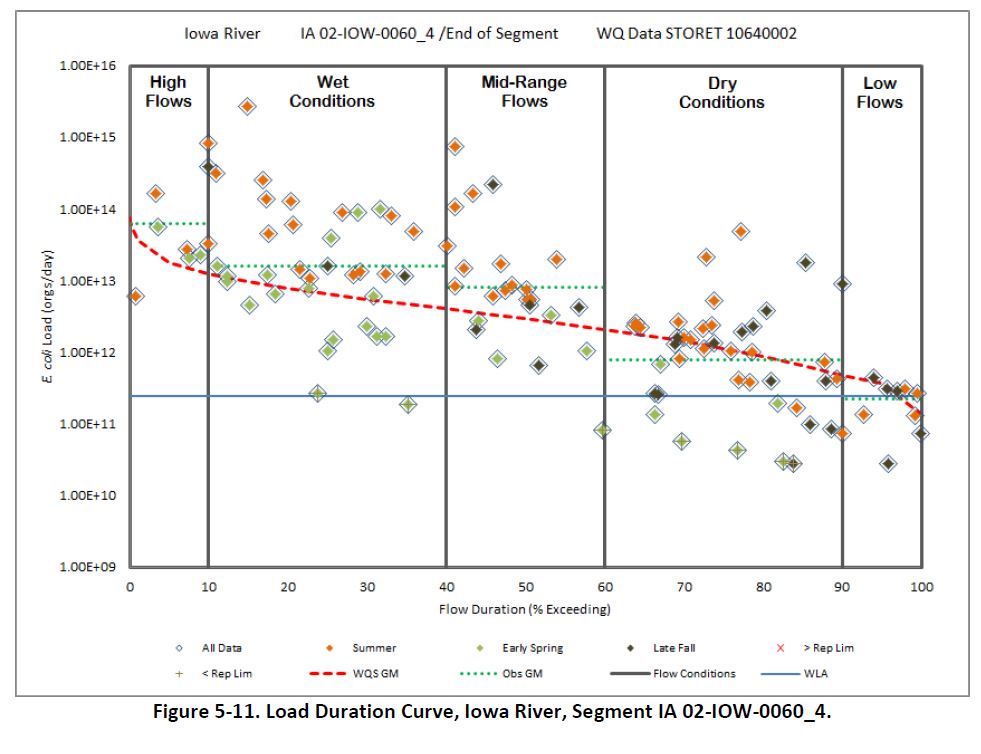
To protect fishing, paddling, and children’s play on the Iowa River itself, where and when should we focus? The Iowa River at Marshalltown needs a 60% reduction in bacteria load to meet the recreation standard during “Wet Conditions” (10-40% flow exceedance). However, it actually meets the primary contact recreation standard during “Dry Conditions” (60-90% flow exceedance). Focusing on unsewered communities in the watershed would NOT be an effective way to address this impairment.
Galls Creek in Hancock County has some of the worst E. coli levels measured in the basin, and would have a larger per-acre benefit to the Iowa River if standards could be met. Galls Creek has no unsewered communities but at least 20 farmsteads located along the creek that could have issues with septic systems overflowing under wet weather. The watershed has little woodland and no pasture, so land application of manure from the several CAFOs in the watershed would be most likely animal source of E. coli.
This is just a partial review of one of three HUC8s in the Iowa River Basin. There is much more to learn from further discussion with people who know the area well, or from on-site investigation. However, I hope I’ve demonstrated how we might squeeze some more insight out of the data we have, in order to make smart investments in water quality.