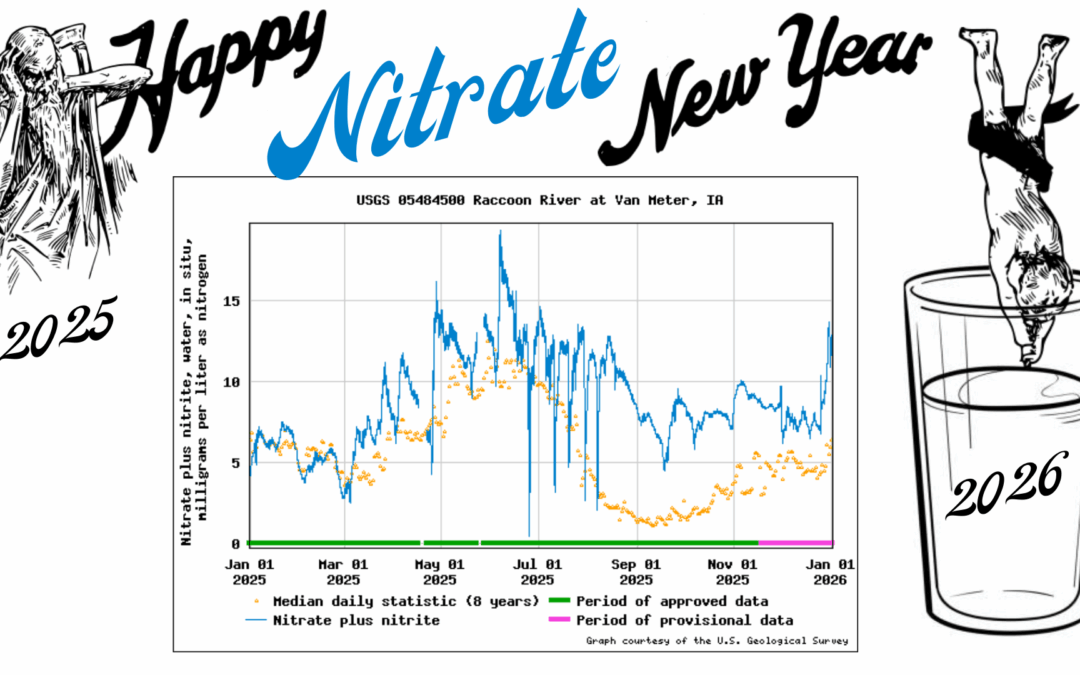
When the ball dropped on New Year’s Eve, nitrate in the Raccoon River was once again above the drinking water standard, closing out a bad year for water quality in Iowa. Below, I’ve compared this year’s nitrate levels to long-term averages at sites in Iowa DNR’s Ambient Stream Network with at least 20 years of data to get a sense for where and when nitrate was highest and what was unusual about 2025.
To understand these patterns, it’s important to remember that 2025 was not a uniformly wet year. Heavy rains in July broke or came near to breaking some records and caused flash flooding in many communities. These rains also raised the water table enough to keep drainage tiles flowing into into the fall. However, most of the state received less than average rainfall from January through May and from August through December. In a band from Ames to Charles City, that works out to a much wetter year than normal. In other parts of the state, like Dubuque, Ottumwa, and Red Oak, that works out to a much drier year than normal.
Nitrate was much higher than normal in the Boone River, Skunk River, and many others in northern and central Iowa, especially in July and August. Nitrate was within 1 mg/L of the long-term average for the Nishnabotna and other rivers in southern Iowa and for the Rock and Floyd Rivers in northwest Iowa. In the table below, red indicates nitrate was higher than average, blue is lower than average, and white is close to the long-term average.
There are some unusually high readings (25 mg/L in the South Skunk River in January) and unusually low readings (3.3 mg/L at Beaver Creek In July) that may have been collected during a storm or other event that is not representative. This is a limitation of monthly grab samples and one reason why maintaining Iowa’s network of real-time nitrate sensors is important. The Ioway Creek sensor was removed at the end of 2024, but the pattern I documented here here (a quick flush of low nitrate surface runoff followed by a gradual release of high nitrate drainage water) happened over and over, in many places in 2025. These kinds of leaks can be avoided with changes in cropping systems and land use, reduced with better nutrient management and cover crops, or intercepted and treated with saturated buffers and wetlands, but we’ll need a lot more of them to prevent another bad year like 2025.
Our grant from the Water Foundation gave me an excuse to dive deep into a big statewide dataset collected by the Iowa DNR. I presented some of that analysis (along with general tips for data analysis) at the Iowa Water Summit in October. Since my slides rarely make sense without the narration, I have also written up a series of set of three case studies about trend monitoring.
I started learning R, a computer programming language for data science and statistics, in 2020. There was a steep learning curve, but now I get to coast downhill. If I can make an interactive map to display which chloride and phosphate readings from a volunteer event fall into the “good” category, I can reuse a lot of that code to make another interactive map that shows which lakes meet the recreation standard for E. coli. If I can figure out how to overlay maps of watersheds and animal feeding operations to calculate livestock density for 60 monitoring sites, it’s not hard to adapt that to calculate a similar metric for wastewater treatment plants. If I can make a good graph for one site, it’s not hard to scale that up to 50 sites.
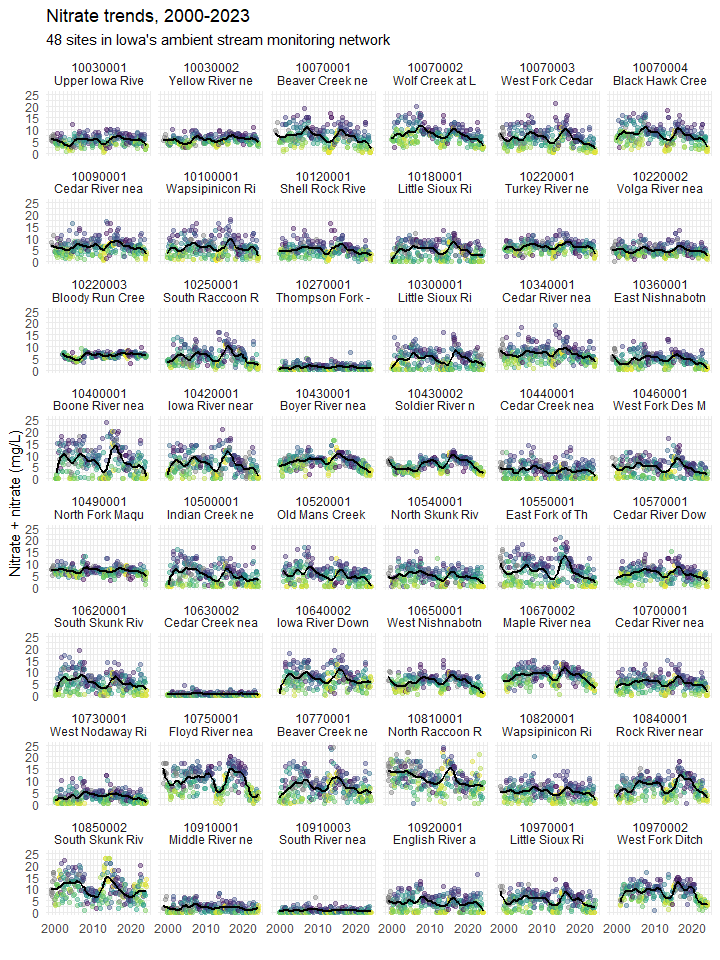
Behold! My finest graph yet! On a single page, you can see 20 years of monthly nitrate data for the 48 sites in Iowa’s Ambient Stream Monitoring network with the longest record. The dots are color-coded to show streamflow at the nearest gage on the day the water samples were collected, yellow when water levels were at their lowest and grading to purple when water levels were at their highest. The black line is a 3-year moving average (or at least a close approximation with LOESS). You’ll notice that nitrate levels in most streams shot up sometime around 2014 and have been declining since. But how much of that is a precipitation-related trend tied to the El Niño-Southern Oscillation and how much is due to conservation efforts in the watershed?
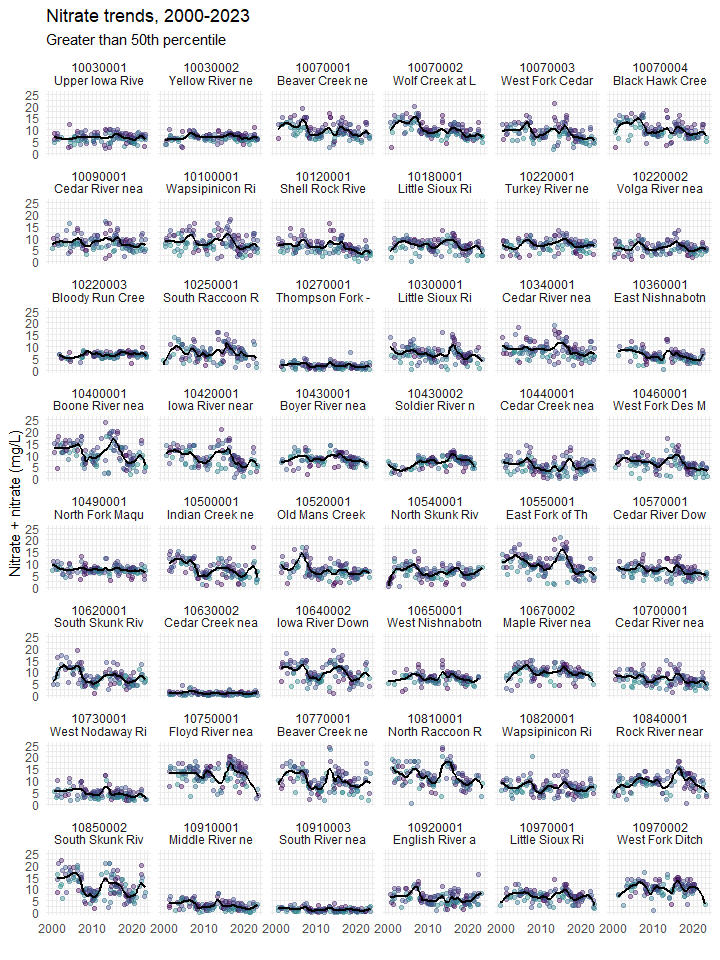
Here comes the magic trick! Watch closely, for when I place into my hat all those samples collected when streamflow was lower than average (yellow and green dots) some of these apparent nitrate trends will…. disappear!
Darn it, that didn’t work at all! For the third of three case studies I’ll link to below, I take a closer look at two of these sites: Black Hawk Creek, where I’d expect a moderate improvement based on cover crop acreage and the East Fork of the Des Moines River, where I’d expect very little improvement. The East Fork actually has a much bigger nitrate trend than Black Hawk Creek and I can’t account for it. Maybe I should give up and leave trend monitoring to the experts at Iowa State University and Iowa DNR, they seem to know what they’re doing (see Danalatos et al. 2022).
However, the trick did work when I compared a watershed impacted by mostly point sources of pollution (i.e. sewage treatment plants) to a watershed impacted by mostly non-point source pollution (i.e. agricultural runoff). This is the first of the three case studies. Phosphorus concentrations have increased in the North Raccoon River and decreased in the South Raccoon has decreased, but that’s entirely due to recent drought. The second case study introduces a new metric for identifying rivers that a strongly influenced by point source pollution, and how to track improvement.
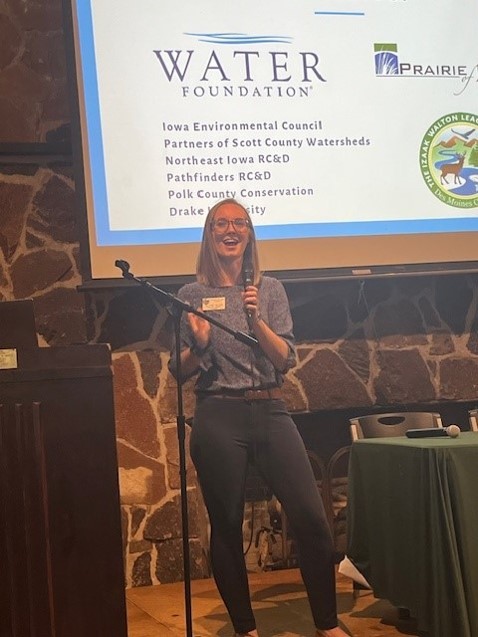
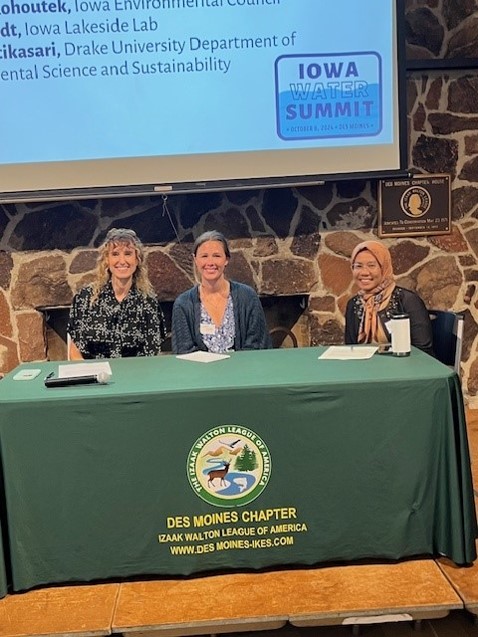
The Iowa Water Summit on October 8 brought together 65 people with an interest in water monitoring for a day of learning and networking. The event was one outcome of the grant from the Water Foundation that Prairie Rivers of Iowa was awarded last year and the regular meetings we’ve been having with seven partner organizations. The Des Moines Chapter of the Izaak Walton League made their facilities available and Heather Wilson (Midwest Save Our Streams Coordinator for the Ikes) did the lion’s share of the planning. Thanks to our presenters, to Bud Hartley for taking these photos, and everyone who helped make the event possible!
Planning events, dipping test strips, identifying and counting benthic macroinvertebrates, shocking fish, incubating bacterial plates, calibrating equipment, maintaining databases, analyzing data, communicating with the public… There’s a lot of work that goes into finding out what’s in our lakes, rivers, and streams! Between the Water Summit and my 8 years (!) working for Prairie Rivers of Iowa, I’m starting to assemble a picture of the organizations that do water monitoring and where to find the data they collect. Even so, this will not be a complete list! Feel free to add some more in the comments!
State and federal agencies
State and federal environmental agencies do a lot of water monitoring and have a lot of expertise, so if you’re looking for data, your first stop should be one of these databases.
BioNet houses fish and macroinvertebrate surveys collected by the Iowa Department of Natural Resources and the State Hygienic Lab. If you want to know which streams support stoneflies or whether biological diversity has declined in a certain creek, this is the place to find out.
How’s My Waterway is a convenient way to access data submitted to the Environmental Protection Agency from both state and local partners. For example, IDNR uploads their data once a year, while Polk County Conservation uploads their data once a month. EPA’s old system was called STORET, but now it’s the Water Quality Portal for downloads and the Water Quality Exchange for uploads.
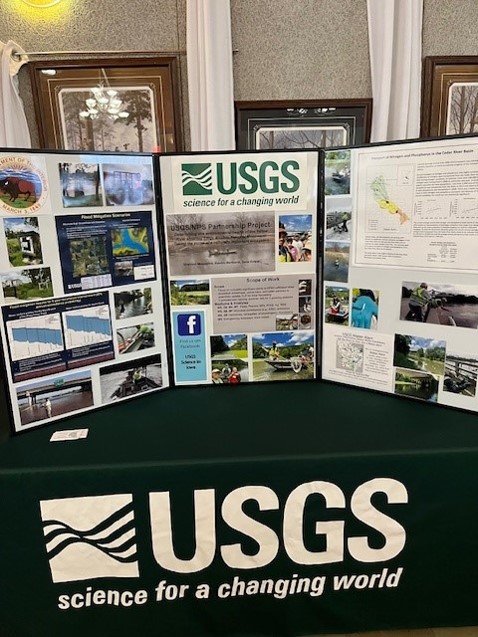
The National Water Dashboard provides access to the US Geologic Survey’s network of stream gages, essential information if you live on a floodplain, if you’re planning a canoe trip, or if you need some context to make sense of your water quality data. The USGS also does quite a bit of water quality monitoring, in partnership with the EPA—the National Rivers and Streams Assessment is the best water quality study you’ve never heard of.
Volunteer programs
Iowa has too many waterways for the agencies to monitor on a regular basis, so if you want to know about water quality in your local creek, you may have to do it yourself. Fortunately, since the end of the IOWATER program, other organizations have stepped up to provide volunteers with equipment, training, and a place to store the data.
Polk County Conservation has a very impressive monitoring program, based on the IOWATER protocols, with data housed on the EPA’s Water Quality Portal. Staff, partners and public volunteers monitor 70 sites twice a month. Partners include Des Moines Water Works, the Cities of Altoona, Ankeny, Des Moines, and West Des Moines along with Des Moines Parks and Recreations and West Des Moines Parks and Recreation.
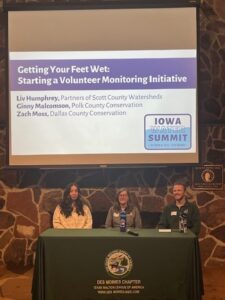
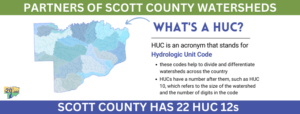
Partners of Scott County Watersheds is one of several organizations with a watershed or regional focus that organize big volunteer monitoring events (snapshots) two or three times a year. They have created their own database and online dashboard to view the results.
Trout Unlimited has been encouraging anglers in the driftless area to monitor water quality with a test strip and mobile app.
Watershed Projects and Agriculture
Prairie Rivers of Iowa originally got involved in water monitoring to educate the public about the Ioway Creek watershed and track conservation efforts in that watershed. Many watershed projects incorporate water monitoring for one or both of those reasons. A typical approach is to collect water samples once or twice a month during the growing season (plus some samples after heavy rains) and send them to a certified lab for analysis. In our case, that’s a lab operated by the City of Ames water and pollution control department, but others watershed projects have partnered with a university or commercial lab.
Have you seen “Moved by Waters?” The documentary by Fourth Wall Films showcases the conservation, education, and citizen science work that Partners of Scott County Watersheds is doing in the Quad Cities and surrounding farmland. In addition to snapshot events they have a long history of research to try to track down sources of bacteria. Our grant helped them do one more round of microbial source tracking; Vice-Chair Steve Gustafson shared preliminary findings at the Water Summit but it wasn’t straightforward!
The Iowa Soybean Association has supported nutrient sampling of streams and drainage tiles for some 19 watershed projects around the state. The Lower Skunk River WQI project is a good example of that—Pathfinders RC&D collects water samples that are sent to the Iowa Soybean Association for laboratory analysis. Several soil and water conservation districts and agribusiness groups are also partners on the project. Since the ISA collects many field edge samples that come with some privacy concerns, they don’t have a publicly accessible database. However…
Agriculture’s Clean Water Alliance has worked with ISA to monitor nitrate in the Raccoon River, Boone River, and Beaver Creek watersheds. They post annual reports going back decades.
Northeast Iowa RC&D has been coordinating water quality monitoring in the driftless area for 25 years, as described in this article. They have created a nice data dashboard for the Upper Iowa River watershed and the Upper Wapsipinicon River watershed.
Colleges and Universities
The Iowa Water Quality Information System is an amazing map that shows you real-time data from a network of nitrate sensors operated by IIHR (Hydroscience and Engineering at the University of Iowa) and the USGS.
Marty St. Clair (formerly of Coe College, now at University of Iowa) and his students have done sampling and laboratory analysis to support the Middle Cedar River, Indian Creek, Upper Iowa, Turkey River, Maquoketa River, and Upper Wapsipinicon River Watershed Management Authorities.
Drake University’s environmental science department has done stream monitoring to support watershed projects and water recreation in Polk County. It’s often a challenge to maintain access to data that’s collected for student projects, but a solution is in the works.
Iowa State University researchers have done a lot of the field scale and edge-of-field monitoring that established the effectiveness of conservation practices including riparian buffers, saturated buffers, bioreactors, and CREP wetlands. ISU is also responsible for tracking various progress indicators for the Iowa Nutrient Reduction Strategy, including compiling water quality data from IIHR, DNR, and USGS.
Closing Thoughts
Finally, there are organizations that don’t collect data themselves, but help make the other data more accessible to the public. The Iowa Environmental Council sends out a Weekly Water Watch newsletter to provide updates on beach monitoring by Iowa DNR, and they’ve been advocating for standardized, easily accessible, user-friendly data.
That’s an idea I support, and there are people working toward an “Internet of Water.” However, I am a bit skeptical when I hear people say “why don’t you use AI” or “you should really get all this data in one place.” Have you ever tried downloading data from the EPA’s Water Quality Portal that was sourced from more than one organization? I have, and I eventually got something useful out of it, but first I had to delete 20 unused columns and then I had to shorten the column names and then I had to clean up the non-numeric entries that one organization had put in a numeric field, and then I had to filter out the sites where monitoring too sporadic to be representative. Bigger, more flexible systems have their drawbacks.
I am more excited about building relationships and improving communication among the various people who care about water quality and who are involved in monitoring, so we can learn from each other and avoid duplication of effort. Hopefully, the Iowa Water Summit and this article are a step in that direction!
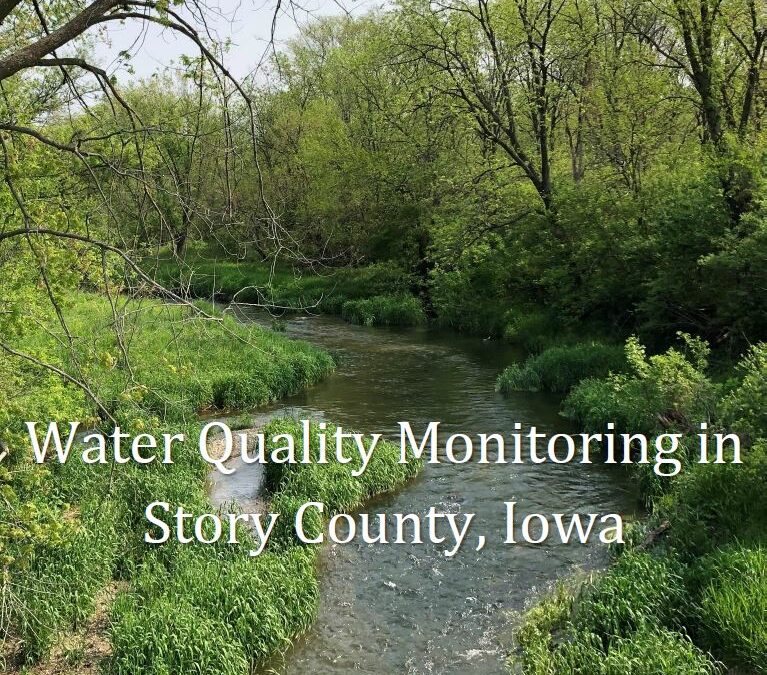
Our 2023 Annual Report is now available with results of both volunteer and lab testing of water quality in lakes and streams in Story County. The 56-page report can be navigating by clicking on headings in the table of contents or by using the “Bookmarks” feature in your PDF reader. Below are some of the key findings.
The volunteer program continues to grow and improve in consistency.
49 volunteers entered 969 data sheets into the Clean Water Hub this season.
Many volunteers are monitoring their assigned site biweekly, with 20 sites sampled at least 20 times.
This was a challenging year for fish and aquatic insects.
In addition to many creeks drying up, volunteers observed dissolved oxygen drop to low levels at 53% of stream sites.
Biological surveys showed mixed results, with some streams scoring poorly but sensitive insects like mayflies present in others.
E. coli bacteria levels in streams remained high.
All thirteen streams with enough data to evaluate this season exceeded the primary contact recreation standard. Three streams exceeded the secondary contact recreation standard: (West Indian Creek, College Creek, and Ballard Creek.
However, over the last four years, most sites on the South Skunk River meet the standard when there is enough water to float a canoe.
Wastewater treatment plants are not yet capable of removing some of the pollutants we monitor, and can have a large influence during drought when effluent is less diluted.
Effluent from the old sewage treatment plant in Nevada was found to be a major source of E. coli bacteria. The new plant, currently under construction, includes a disinfection system that should address the problem.
Stream sites downstream of sewage treatment plants tend to have elevated chloride and phosphate.
The encouraging trends we noted in the 2022 report held up with another year of data. Water quality trends are often driven by weather, but we pulled out subsets based on streamflow to remove some of this influence.
E. coli in the South Skunk River below the Ames Water Pollution Control Facility has improved relative to the pre-2014 baseline period, especially during dry conditions when wastewater has the greatest influence.
Nitrate in the South Skunk River below the confluence with Ioway Creek improved relative to the pre-2014 baseline period, even after excluding dry periods. This pattern is consistent with improvement from conservation practices.
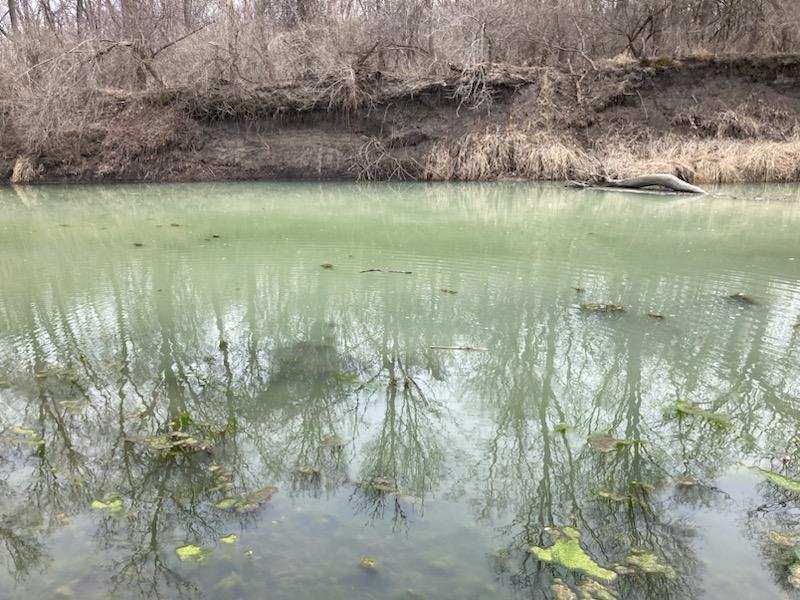
On Tuesday, March 12, residents on the north edge of Ames noticed that the South Skunk River was cloudy and had turned an unusual shade of bluish green. By the time I looked at it on the afternoon of March 13, the color had faded and the water was less cloudy, but it still had a soupy, streaked appearance that I’ve seen before in lakes following a toxic algae bloom. I’m gonna go out on a limb here and say it’s blue-green algae (cyanobacteria).
“Algae” is a word that gets lazily applied to any living thing that does photosynthesis but that isn’t a plant: from tiny glittering diatoms in a drop of pond water to giant kelp in the oceans. The other kind that I noticed in the South Skunk River this week is filamentous green algae, which forms slimy hair-like strands on rocks and globs on the water’s surface. Color is the least of the differences.
Cyanobacteria are tiny and simple. There’s strong evidence that the chloroplasts in the cells of plants and green algae are the captured descendants of cyanobacteria. This amazing phenonemon is called endosymbiosis, and it’s happened multiple times in the history of life on earth. If you’ve never heard of it, I’d recommend this YouTube video, which explains the concept with cartoons.
The practical reason to know if the green stuff in the water is cyanobacteria is because they can produce toxins. I wasn’t able to get a sample tested for microcystin (and chances are, this algae bloom will have dispersed by the time you read this), but I would recommend keeping your dog out of water that looks like paint or pea soup, to be on the safe side.
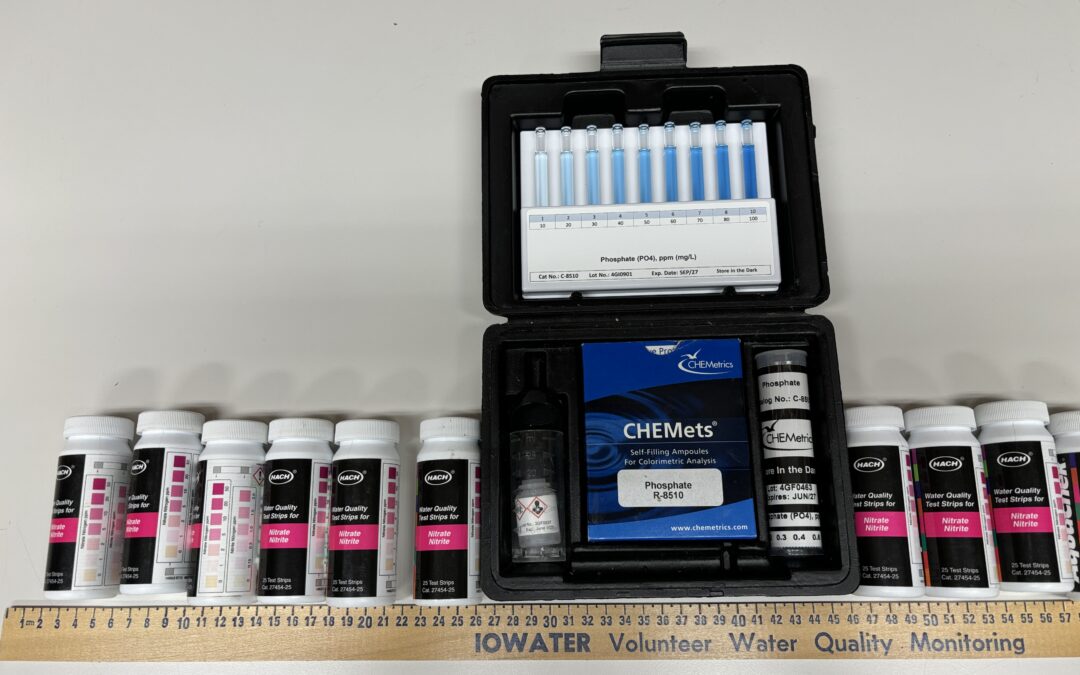
Why is the water so green, so early? Algae growth is limited by the availability of light, heat, and fertilizer–phosphorus in freshwater, and to a lesser extent nitrogen. We’re getting unseasonably warm weather before there’s any leaves on the trees to shade the water. As for the fertilizer, I’m not sure where it came from, or when. Rick Dietz and I tested nitrate and phosphate with field kits on Wednesday and measured 0 mg/L. Nitrate and phosphorus levels were also fairly low at this site when we collect grab samples in February. Maybe something was washed into the river earlier in the week, but it has since been used up by the algae or has washed downstream. I’ll amend this article if I find out something conclusive.
 (1)")


 under magnifying glass")


")
