In November, the EPA partially approved Iowa’s 2024 Impaired Waters List, adding six additional river segments where drinking water use is impaired by high nitrate levels. I think EPA was right to do this, but I have some concerns. This is the letter I submitted during the public comment period.
Dear Water Division Staff,
I agree with the EPA’s decision to add seven river segments to Iowa’s impaired waters list. I hope that this change will lead to greater transparency about how nitrate pollution of surface waters affects the cost and safety of drinking water, but am concerned there will be unintended consequences.
Iowa’s Credible Data Law has sometimes been a convenient excuse to assess fewer waters, and thereby discover fewer problems. However, that doesn’t seem to be the issue here. Each of the water bodies on this list had at least one “credible” nitrate sample exceeding the 10 mg/L drinking water standard during the three year assessment period.
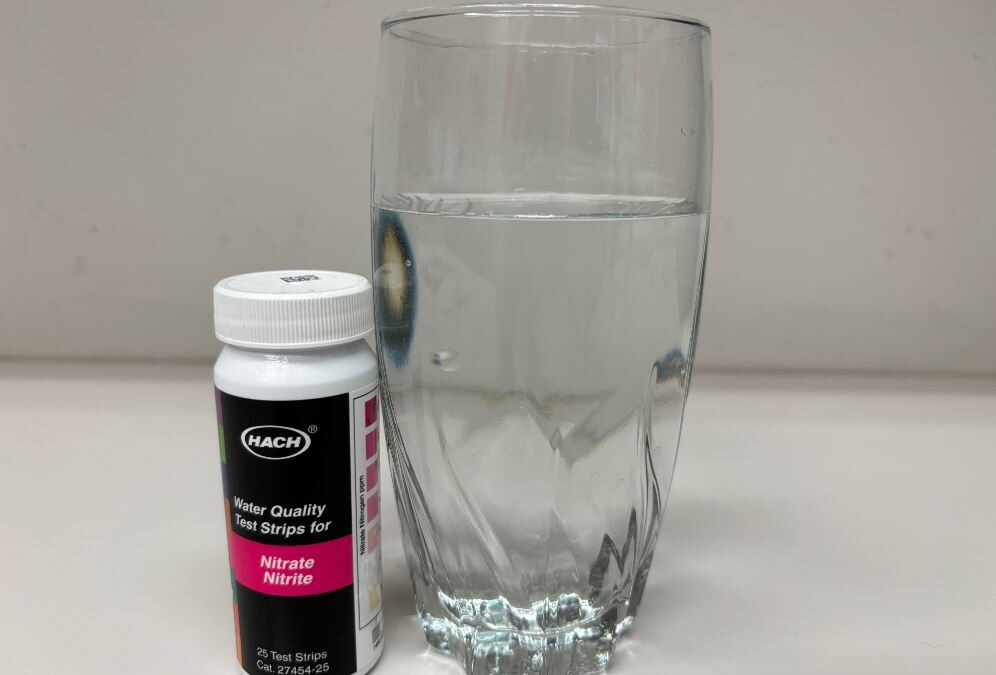
Raccoon River near Des Moines: 38 of 755 samples collected by Des Moines Water Works exceeded 10 mg/L
Cedar River near Cedar Rapids: 1 of 36 samples collected by the USGS, and 7 of 151 samples collected by Cedar Rapids Water Works
As I understand it, the issue is the threshold for impairment. Since fewer than 10% of the samples (accounting for some statistical correction factor) exceeded 10 mg/L, IDNR says these sites meet the standard. EPA says they do not.
The Iowa DNR’s position is not defensible. In the draft 2024 assessment, Raccoon River near Des Moines was shown as fully supporting its designated use for drinking water because
A) Nitrate in the Raccoon River exceeded 10 mg/L nitrate less than 10% of the time during the 2020-2022 assessment period
B) Nitrate in finished drinking water at the Des Moines Waterworks never exceeded 10 mg/L.
This makes no sense. Even one sample exceeding the Maximum Contaminant Level for nitrate would constitute a violation of the Safe Drinking Water Act, requiring public notice. To avoid this, the Des Moines Waterworks had to run its nitrate removal facility for weeks in 2022 at a cost of $10,000 a day, as well as blending water from other sources and asking residents to reduce water use. Clearly, poor water quality is limiting that beneficial use of the river water!
However, the South Skunk River no longer supplies drinking water to the City of Oskaloosa. The City now gets its water from an alluvial aquifer, and is able to achieve low levels of nitrate in finished water (1.17 mg/L, in the latest Consumer Confidence report) without expensive treatment. I understand that the Clean Water Act does not allow designated uses to be removed if restoring them is still achievable. However, I hope that in prioritizing and writing TMDLs we can be cognizant of facts on the ground. In the unlikely event that a TMDL for the Skunk Skunk River is written and it leads to stricter effluent limits for upstream point sources, we might be imposing real costs on Ames, Story City, and Nevada without achieving real benefits for Oskaloosa.
I am also concerned that disallowing the 10% binomial rule might lead to further politicization of funding for water monitoring. Water quality in rivers is highly variable, and daily or weekly monitoring might pick up on a short-term spike in nitrate that is missed by monthly monitoring. If a single sample can trigger impairment but there are no rules on how often a site has to be monitored, cutting budgets for monitoring programs becomes a tempting way to evade regulation and controversy.
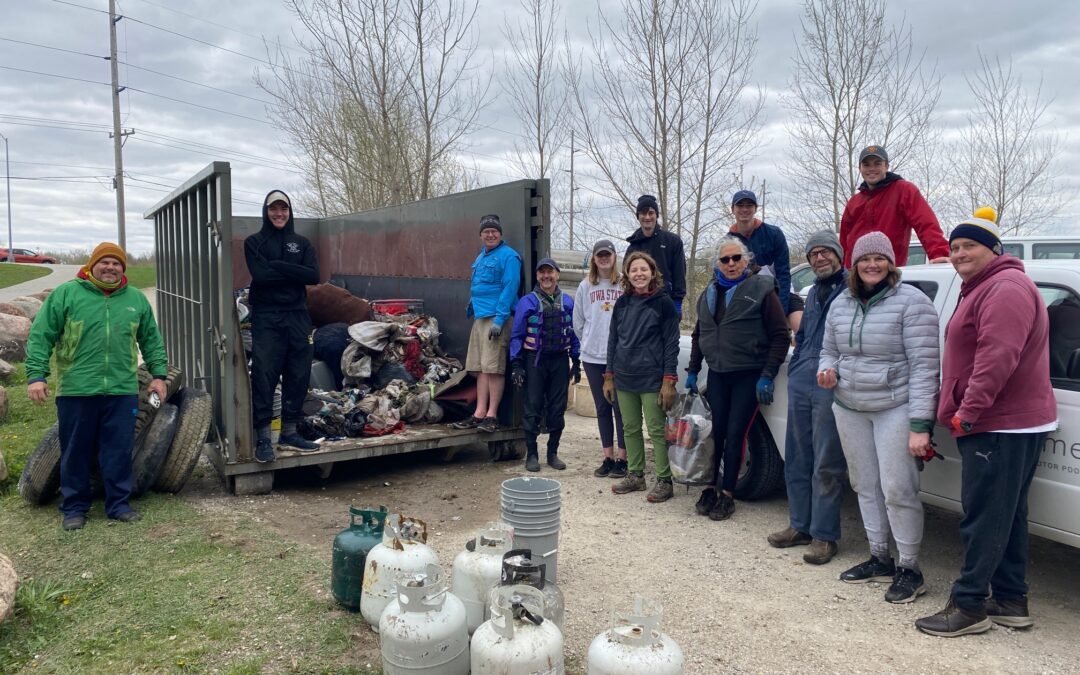
On April 20, volunteers cleaned up trash along a 3.5 mile stretch of the South Skunk River in Ames, from River Valley Park to S. 16th St. Several people also ventured up Ioway Creek, and those who stayed on shore had plenty to do. The fast current meant we arrived at the destination earlier than expected, where we set to work clearing out an abandoned campsite. Judging by some of the items we found, families with children had stayed there, so please support organizations that work on affordable housing and provide emergency assistance. In between stops at sandbars to retrieve trash, there was ample opportunity to enjoy the river. The fast current made for a fun ride through some mini-rapids (nobody tipped!), and we saw kingfishers, great blue heron, and a bald eagle.
Chilly weather (high of 48 degrees) may have dampened some of the initial enthusiasm for our spring 2024 creek cleanup event. We went from having not enough canoes for everyone who registered, to several extra canoes. With a smaller flotilla than last spring, we can’t claim a record breaking haul, but we did remove more more trash per person! In addition to the usual cans, bottles, plastic and styrofoam, finds included four tires, seven empty propane tanks, a shopping cart and a microwave.
April 2023: 3,020 pounds/40 people = 76 pounds/person
April 2024: 2,100 pounds/16 people = 131 pounds/person
Tony Geerts likely exceeded that average figure, arriving at the take out point with a big tractor tire. It would have made a great picture, but as I was rushing up to capture the moment, my phone slipped out of my hands and into the river! Fortunately, other people took photos and have shared them with me.
Assembling the tools, canoes, food, and people was a collaborative effort involving Prairie Rivers of Iowa, the City of Ames, Story County Conservation, the Skunk River Paddlers, and the Outdoor Alliance of Story County. Thank you to all who volunteered, organized, and supported the event.
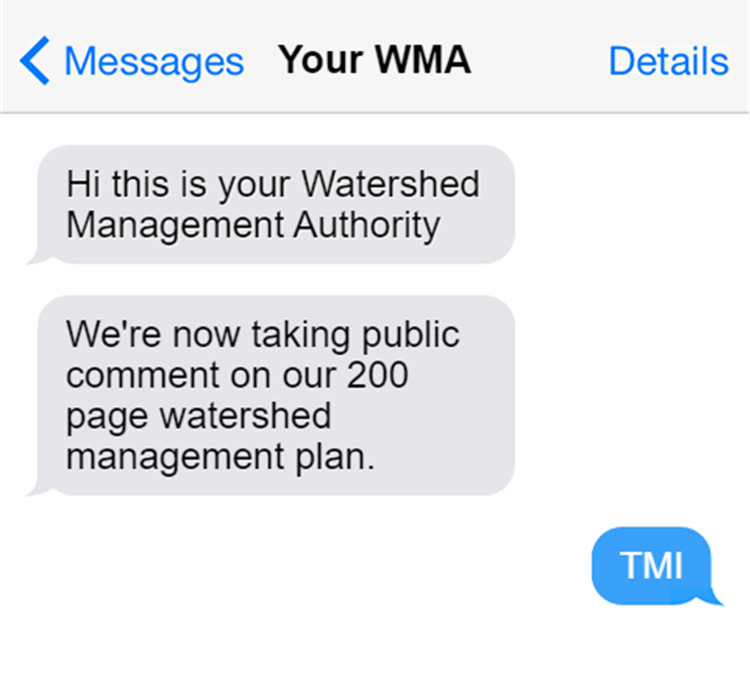
I missed the deadline for public comment on the new watershed plan for the Headwaters of the South Skunk River. We were given only two weeks and it’s a 200-page document. I can either respond with a quick text message: “TMI” (Too Much Information) or with a careful read and 700-word article. Since the deadline is passed, these comments are really meant for our readers who might be wondering what’s in the plan and what it will mean for the river.
Watershed Management Authorities (WMAs) are authorities in name only, with no taxing or regulatory authority, and given no direct funding from the state. Quarterly WMA meetings are a good forum for sharing news about water-related projects and opportunities, but some WMAs go years without managing a budget or holding a vote. Skimming the plan gives me hope that the Headwaters of the South Skunk River WMA could be more productive.
One of the most illuminating parts of the plan is this piece, which explains the role of a Watershed Management Authority, its member jurisdictions, and some of its partners. Chapter 7 fleshes out what needs to be done and who’s responsible. Chapter 8 fleshes out where they could get the money to do it. Put together, it’s a road map for getting some conservation practices on the ground, and cleaning up the water.
The report includes a lot of good technical information about pollution and solutions. I especially like Chapter 5, with its emphasis on practices that can address both nutrient reduction and other issues like habitat and flooding. There are some new ACPF maps for Hamilton County that will be very helpful for working with farmers to find suitable places for bioreactors, wetlands, and other structural practices. There’s an eye-opening section on absentee-owned farmland (section 2.03) and why it might not be as big a barrier to conservation as people think it is.
But like most watershed plans, the emphasis is on all the tasks that were completed and all the information that was compiled, rather than what was learned and why it’s important. This style of technical writing has two negative consequences:
First, it makes it hard for a casual reader to tell the difference between what we know and what we don’t know. Here’s a table that looks like a list of invasive species in the watershed, but is actually a list of invasive species in the state, that may or may not be found in this river system. Then there’s a table of streams with designated uses, but it doesn’t actually tell us which ones can support fishing or swimming. Most of the smaller streams are only presumed to be swimmable, and if the DNR gets around to checking (through a field study called a Use Attainability Assessment), the rebuttable presumption would likely be rebutted. I have spent many hours dealing with the confusion resulting from this little caveat: see Chapter 2 of the Story County Water Monitoring Plan.
Skimming through page after page of maps and tables gives the impression that the watershed has been exhaustively researched, but some of the main recommendations of the plan are for additional assessments that wouldn’t fit in the budget.
We know that normal farming practices can leak nitrogen and phosphorus, but we don’t know which areas are leakier than average, to be able to prioritize conservation practices where they can do the most good. The plan recommends additional monitoring in Hamilton County and the construction of a computer model.
We don’t know much about flood risks and mitigation opportunities in the watershed. The plan recommends commissioning a hydrologic assessment.
Second, it reinforces a very human tendency to see what we expect to see. If you expect to see high nitrogen levels in the South Skunk River, you have to look very carefully at the graph to realize that no, nitrate was actually quite low the last two years (a median of 3.1 mg/L) because of the drought. I didn’t notice it until my third look at the poster above. If the report is full of maps and tables that don’t seem important, or that tell you things you already know* then you stop looking carefully. And that’s how you end up setting a target that would require an 80% reduction in nitrate, relative to the long-term average (8.8 mg/L). Fortunately, I caught this during the public comment period, and authors are fixing it for the final draft. I mention this not to criticize anyone, but to illustrate why it’s important (and not easy) to connect the dots between data, their implications, and action.
* A lot of the inventory chapter reads like “Figure 1 – Central Iowa is flat, Figure 2 – Central Iowa has a lot of corn and soybean fields, Figure 3 – The fields have drainage tiles, Figure 4 – Central Iowa raises a lot of hogs.”
I hope that Prairie Rivers of Iowa can work with the new Watershed Management Authority to help connect those dots, and help to implement the recommendations in what I think is a solid plan.
Thanks to the 15 volunteers who helped to catch benthic macroinvertebrates (bugs) and test water quality over the weekend!
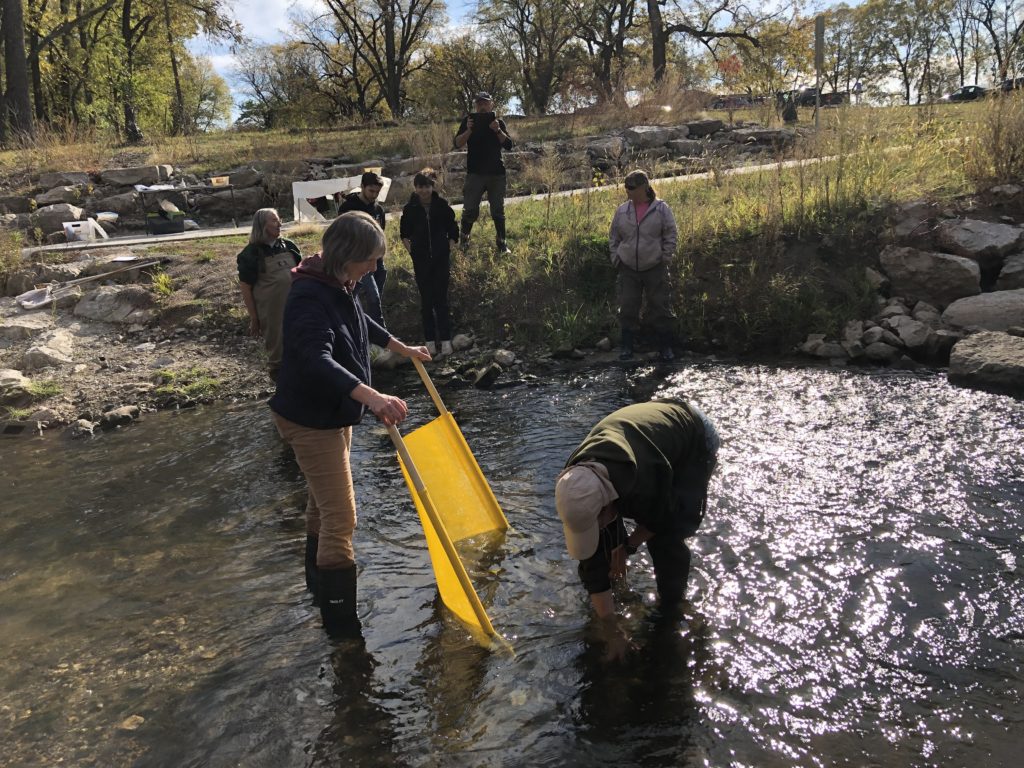
Volunteers capture benthic macroinvertebrates with a kick net, one of two methods we tried.
Ioway Creek “Snapshots” in May and October are a tradition going back to 2006. Volunteers test water quality at many locations on the same day to get a better picture of what’s going on in the watershed. Since the IOWATER program ended, Prairie Rivers of Iowa has gathered supplies and planned events to keep the tradition going, but this year there was just one little snag: there was barely any water in Ioway Creek or its tributaries!
For most of this fall, our usual gathering place at Brookside Park has looked more like the photo on the left.
Not a problem. The South Skunk River still had flowing water, and this was as good an opportunity as any to survey benthic macroinvertebrates (aquatic bugs), an indicator of water quality and habitat quality in rivers. We were helped in this task by Susan Heathcote, a trainer with the Izaak Walton League’s Save Our Streams program. If you’d like to become certified and missed out on this opportunity to complete the field portion of your training, keep an eye out for more training events with Susan in early spring.
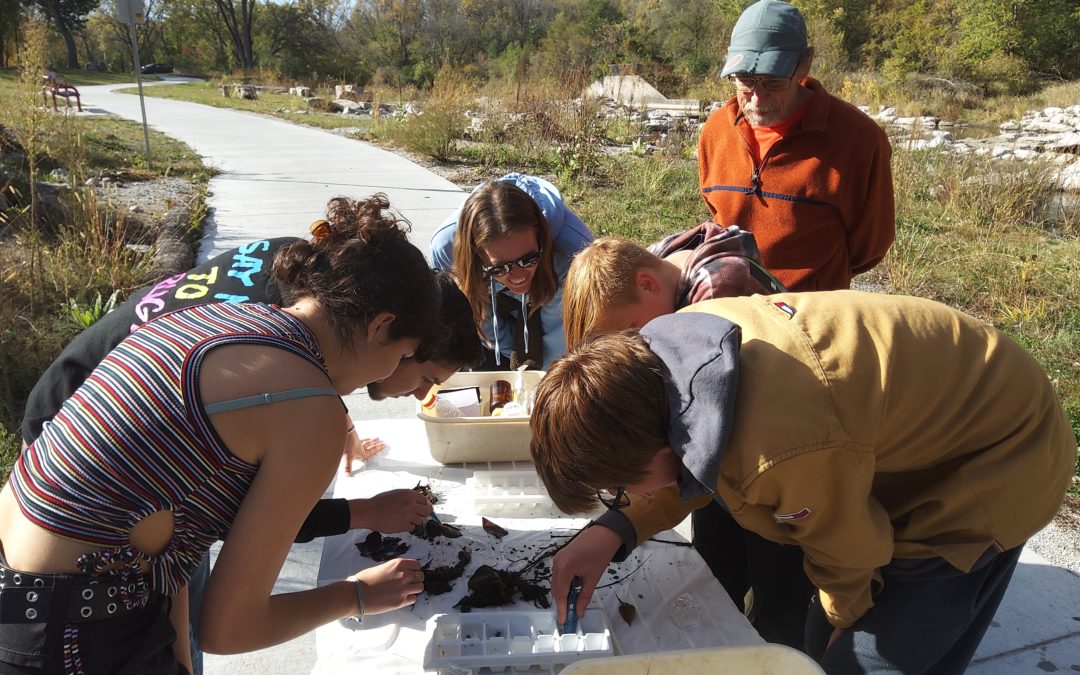
Photo credit: Rick Dietz. Volunteers pick invertebrates off rocks and leaves and sort them in ice cube trays.
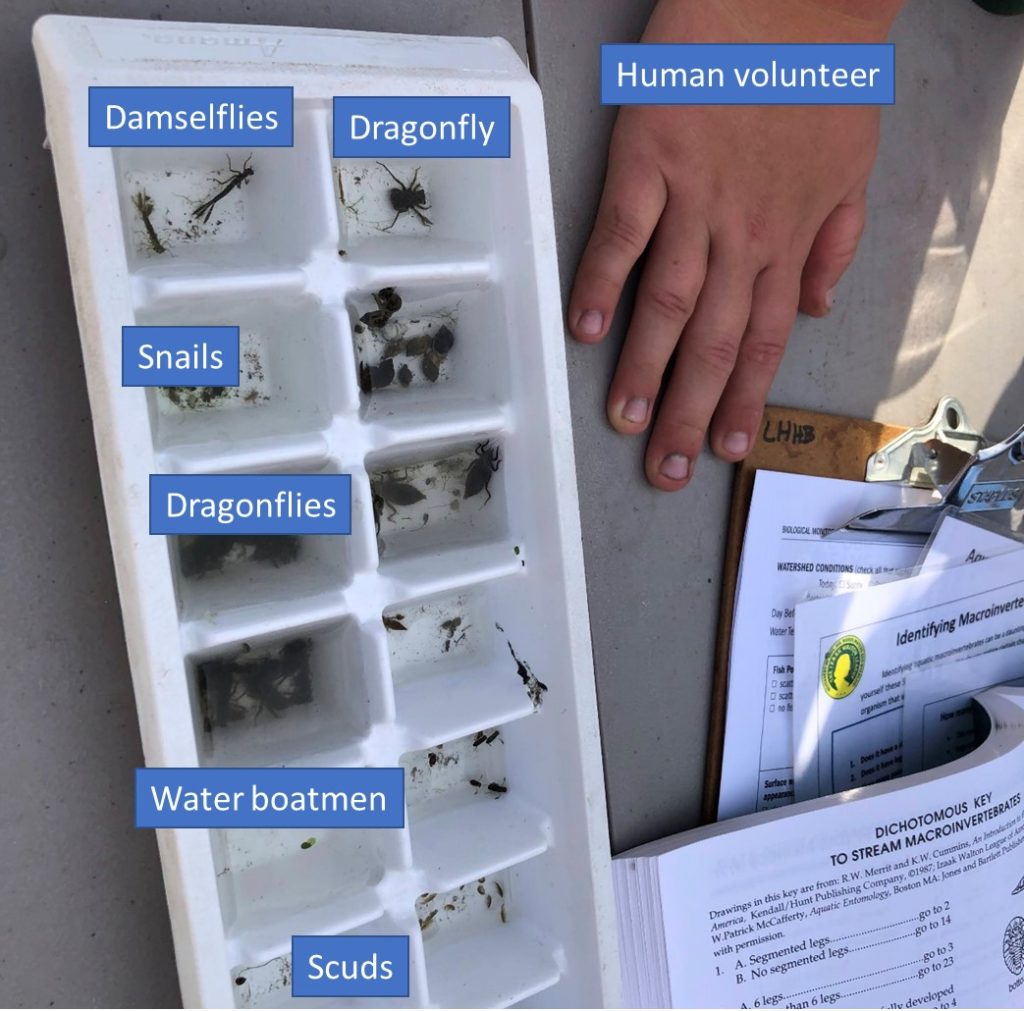
In addition to crawfish and dragonflies (always a hit with kids), we found a variety of smaller critters, including sensitive mayflies and stoneflies. Overall, the invertebrate community in the South Skunk River was “good.” In contrast, another stream we surveyed this week (West Indian Creek south of Nevada) had a “poor” score with mostly net-spinning caddisflies. We’ll discuss some possible reasons for this difference at a webinar on November 2nd.
Another option for when streams are dry is to spend some time interpreting the data we have. Following some water quality testing in the Skunk River, I gave a presentation to put those measurements into context. I think the data feels more relevant when you’re at the water’s edge and have just gone through the process of collecting it! If you prefer to do your learning somewhere warm and comfortable, we’ll be covering similar information at a webinar on November 2nd.
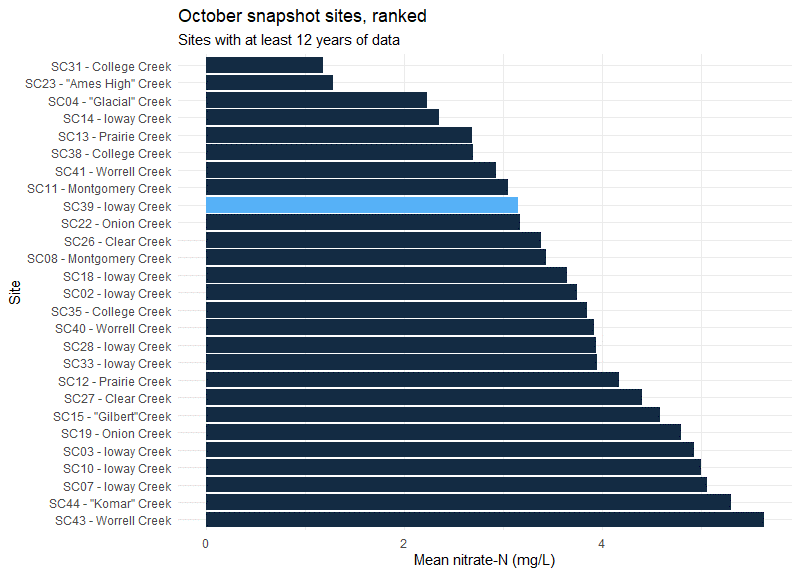
This fall, nitrate is zero in most streams that have any water, but over the past 15 years we’ve been able to see which tributaries have the highest and lowest levels.
Another hitch. Thunderstorms were forecast for Sunday! We changed the date to Saturday and are glad we did; the weather was beautiful. This also gave us the opportunity to set up equipment so we could capture water samples from the big rain on Sunday. Three volunteers helped me retrieve a dozen samples on Monday. The samples will be tested for E. coli bacteria and optical brighteners, which may help us find and fix septic and sewer leaks.
Ryan checks a crest stage recorder (a low tech tool for seeing how high the water got) and puts a fresh bottle in a storm sampler.
Many thanks to all who participated. We hope to see you at the next watershed snapshot in May, and hope the water levels will be back to normal!
Water quality in the South Skunk River is still poor but has gotten better in the last five years. One reason for improvement is a new disinfection system at the Ames wastewater treatment plant.
Dr. Chris Jones recently shared a water quality index he developed for Iowa rivers, combining five important water quality metrics. Of the 45 sites in the Iowa DNR’s ambient monitoring network, the South Skunk River near Cambridge scored “poor” and ranked 34th overall. This site also has the 3rd highest phosphorus and the 5th highest E. coli levels.
A follow-up article looked whether the current (2016-2020) water quality index has changed from previous decades. Most rivers have stayed the same or gotten worse, but the South Skunk had a better score. Three of the metrics (total phosphorus, total nitrogen, and E. coli bacteria) improved, while one (turbidity, a measure of sediment in the water) got worse.
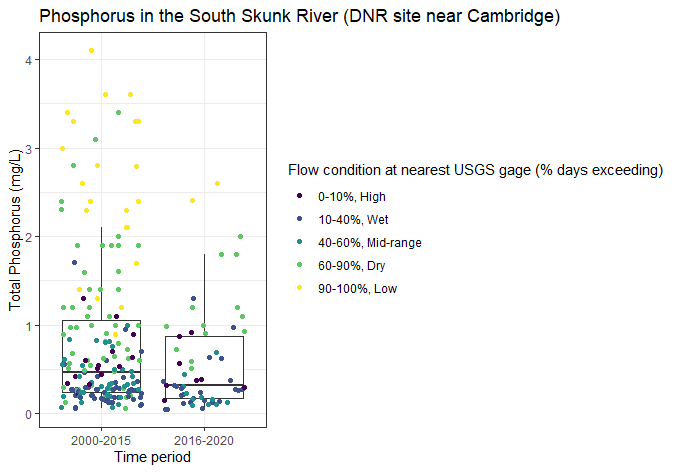
Phosphorus and muddy water usually go together, so this odd pattern demanded some explanation. I did my own analysis of the data, curious if the changes were happening under drier conditions (when wastewater has a bigger influence), wetter conditions (when agricultural runoff has a bigger influence) or both.
See last week’s post for an explanation of the flow categories I’m using. I use a lot of boxplots, which show both the central tendency and the spread of the data. The lower end, middle, and upper ends of the box are the 25th, 50th (median) and 75th percentiles. The “whiskers” show the maximum and minimum, unless they’re really far out there, in which case the “outliers” represented by dots. Water quality data never fits a bell curve, so lopsided boxes and outliers are to be expected.
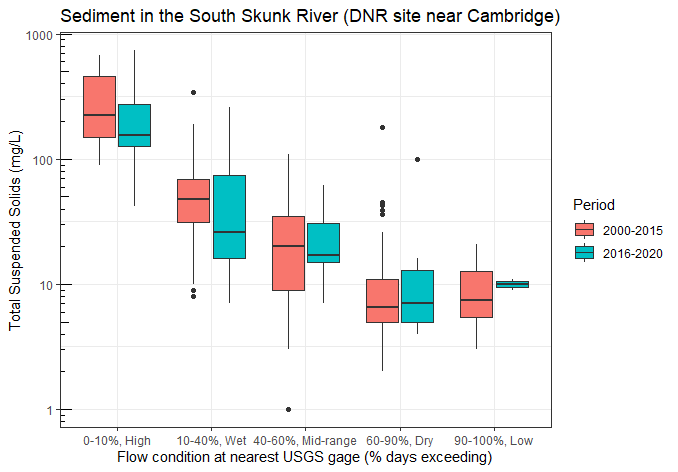
It turns out that the river didn’t get any muddier (it got less muddy) when you compare wet conditions to wet conditions and mid-range conditions to mid-range conditions.
It’s just that the past five years were a little wetter and so a larger share (43% vs 29%) of the samples were collected during wet conditions when the river was moving swiftly and carrying more sediment. A smaller share (25% vs 42%) of the samples were collected during dry and low-flow conditions when the water is usually clear. That made the average sediment concentration increase.
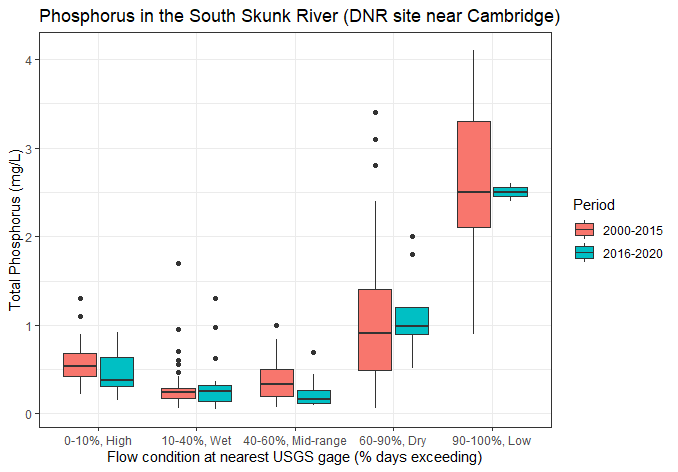
Weather also can explain trends in phosphorus. In the past five years, a smaller share of the samples were collected during dry and low-flow conditions when phosphorus concentrations are especially high. That made the average phosphorus concentration decrease.
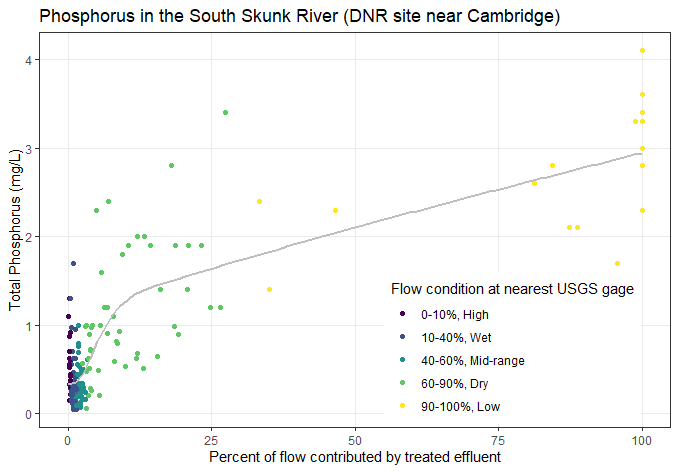
Why is phosphorus so high when it’s dry? The monitoring site in question is just below the outfall of Ames Water Pollution Control Facility on 280th St, about 4 miles north of Cambridge. This facility discharges over 6 million gallons a day of treated wastewater. When conditions are dry, the effluent is less diluted, and so phosphorus in the stream approaches phosphorus levels in the effluent (which averages 3.8 mg/L), as shown in the graph below. This year we’ve also monitored West Indian Creek below the Nevada wastewater treatment plant and have seen the same pattern.
Wastewater treatment plants are regulated to minimize the impact on receiving waters and the Ames WPC Facility has one of the best compliance records in the nation. However, while the treatment process is very good at removing ammonia, solids, and oxygen-depleting substances, the process is not that effective for removing nutrients.
The Iowa Nutrient Reduction Strategy is not voluntary for wastewater treatment plants. The Ames Water and Pollution Control Department commissioned a feasibility study as a condition of its permit, which determined that the facility could achieve a 67% reduction in total nitrogen and a 75% reduction in total phosphorus by replacing its trickling filters with an activated sludge treatment system. This new system will be phased in as the filters reach the end of their useful life (starting in 2027) and will cost $39.6 million.
In the last five years we have not seen any reduction in phosphorus during dry and low-flow conditions when wastewater treatment systems have the biggest influence. However, there was a reduction in phosphorus* under mid-range and high flow conditions! This is really interesting–I’ll have to look at some other data sets to see whether it holds up and whether we can link it to conservation practices in the watershed.
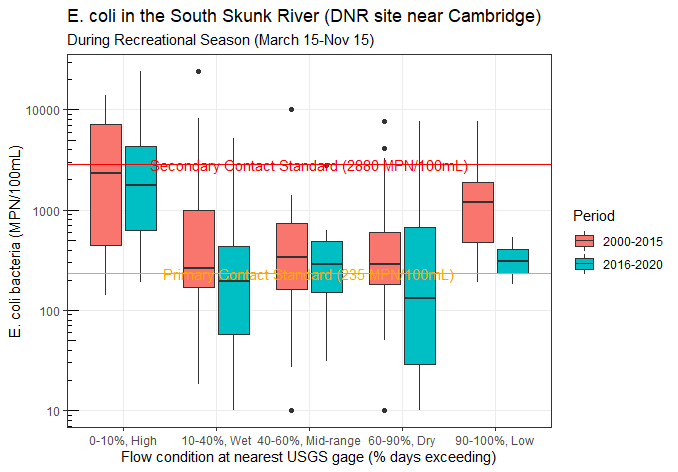
For E. coli, we see improvement across all conditions, with the largest improvement during low-flow conditions* when wastewater has the biggest influence.
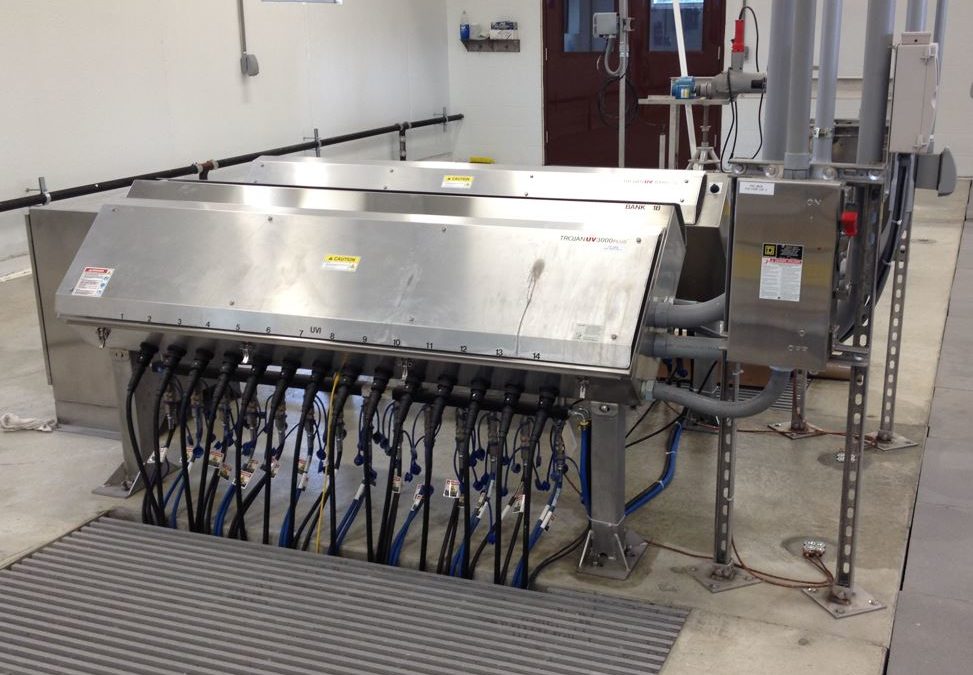
The effluent discharged to the river has gotten a lot cleaner since the Ames Water Pollution Control Facility built $2 million disinfection system using ultra-violet (UV) light. The system was completed in March of 2015. During the recreational season (March 15-Nov 15), treated effluent passes through two banks of lights that kill microbes. Prior to this, some E. coli and pathogens could make it through the system and end up in the river. Chlorination, a good solution for disinfecting drinking water and swimming pools, is not ideal for wastewater because it can harm fish.
Kris Evans, an environmental engineer for the City of Ames and the project manager, said this about the system:
“By using UV we continue to be “chemical free” for treatment of the wastewater and it’s much safer for staff since they don’t have to chlorinate and dechlorinate. When flow is low at the plant, we are able to lower the intensity of the bulbs to save energy and still meet permit limits; as flow increases so does the UV light intensity. The City started design of the UV system before it was mandated in a permit; we knew it was coming, but wanted to be proactive in the treatment of water, making it safer for those who recreated in the river. It was also the first project the department funded through an State Revolving Fund (SRF) loan.”
We still see high E. coli levels in other streams that receive effluent, but smaller wastewater treatment systems are also making the switch to comply with new permit requirements. In Story County, Gilbert added a UV disinfection system in 2019, the Squaw Valley HOA completed theirs in 2020, and Nevada will build a new wastewater treatment plant in 2022 that includes UV disinfection.
* I’ve written before about the challenges of detecting water quality trends. I’m pleased to report that two of the trends discussed here (a reduction in phosphorus at mid-range flow conditions, and a reduction in E. coli in dry and low-flow conditions) were statistically significant at 90% confidence level, using a test of the difference between medians. The approach employed here (sorting by flow conditions) may be a good way to control for weather and reach more reliable conclusions. It’s exciting to have some good news that holds up to further analysis!
")
")
")