by Dan Haug | Jul 31, 2025
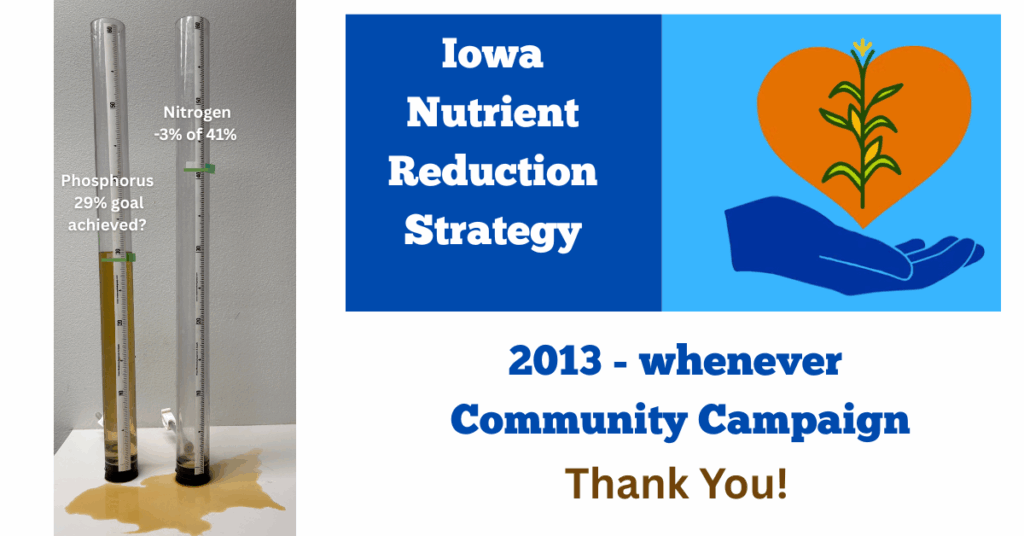
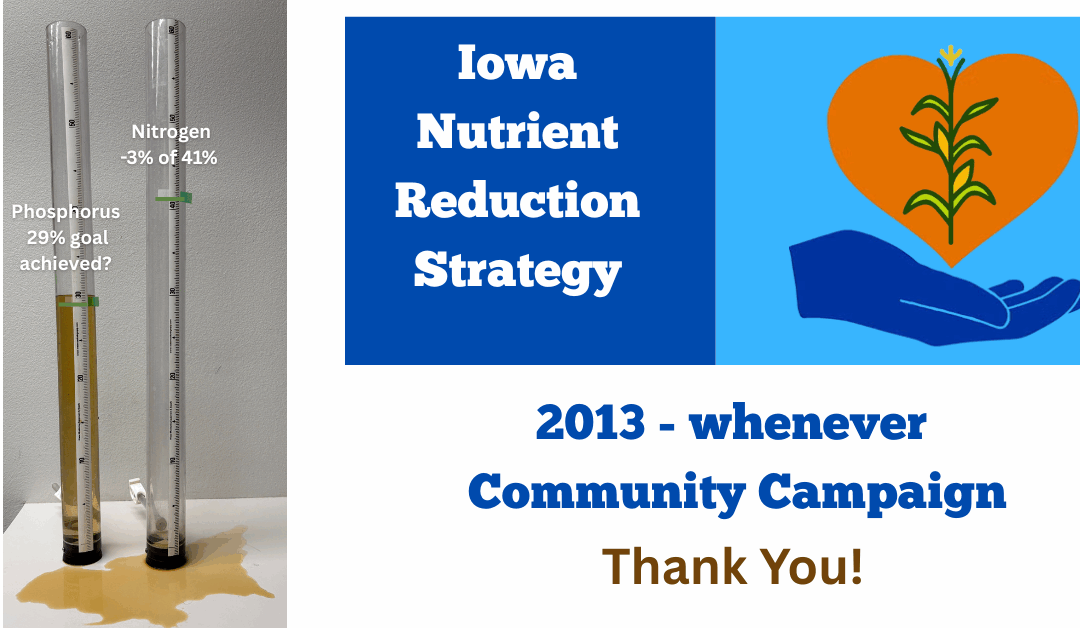
You know those United Way posters with a thermometer showing progress toward a fundraising goal? The image above is my attempt at a similarly easy-to-understand progress meter for the Iowa Nutrient Reduction Strategy (INRS). Based on changes to farming practices in the decade since the Iowa Nutrient Reduction Strategy was released, we should have met our goal for phosphorus but have only reduced nitrogen losses by 2%, not enough to undo the increases of the previous decade. These are best-case scenarios which do not account for manure, legacy sediment and nutrients, and interactions between practices.
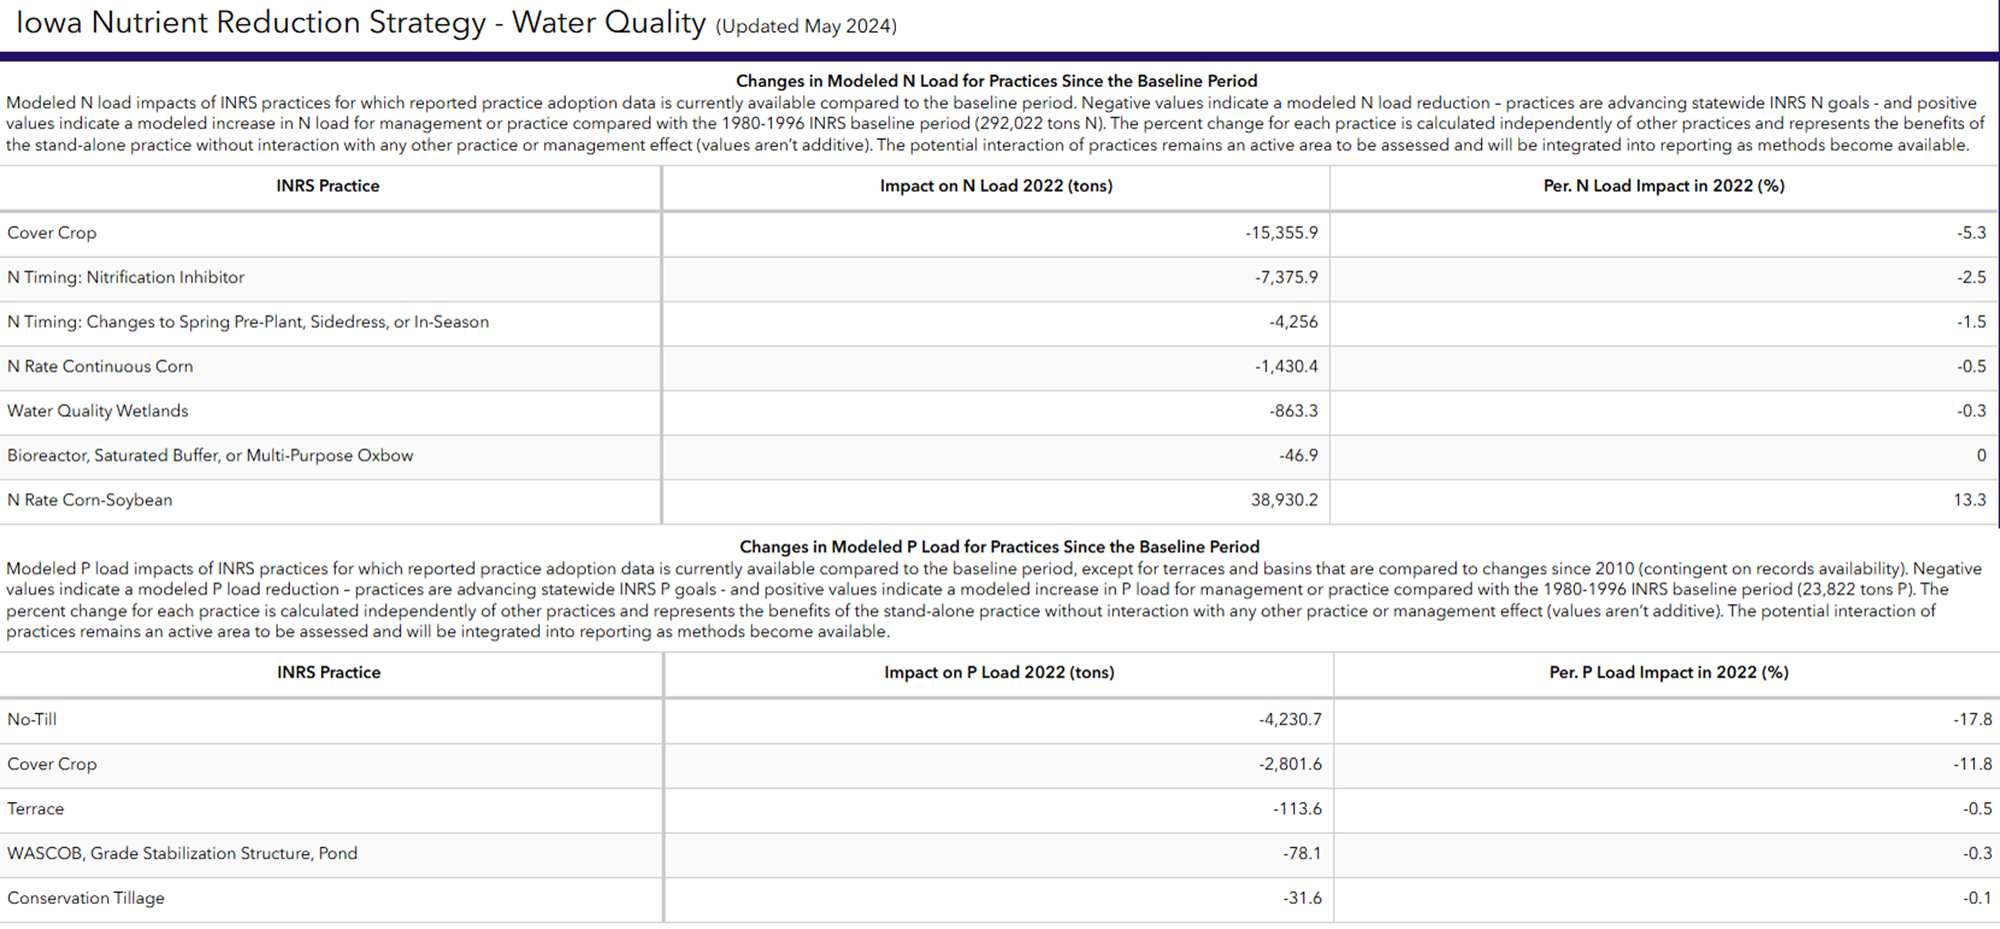
Iowa State University is responsible for tracking the progress of the INRS, and has created a set of data dashboards covering dollars spent, minds changed, conservation practices on the land, and water quality trends in the rivers. These were updated in May of 2024. There is no top-line summary of where we stand relative to our goals, but wasn’t hard to make one. I just added up the numbers in a pair of tables labelled “change in modeled nitrogen/phosphorus load for practices since the baseline period.”
Baselines, Goals and Timelines
The timeline requires some explanation. The INRS was released in 2013, but the baseline period is 1980-1996. That’s because the Hypoxia Action Task Force was formed in 1997. The task force set a goal of reducing the size of the dead zone in Gulf to 5000 square kilometers (1,930 square miles). The target date for meeting that goal has been pushed back several times. Despite several dry years, the five-year average extent of the dead zone is still twice as big as the target. Last year it measured 6,705 square miles, larger than Connecticut or Hawaii.
To meet the goals for shrinking the dead zone, each state would need to reduce the amount of nitrogen and phosphorus lost down the Mississippi River by 45%. The Iowa Department of Natural Resources determined that mandatory upgrades for 102 municipal wastewater treatment systems and 28 industrial facilities could reduce state’s overall nitrogen load by 4% and phosphorus load by 16%. The remaining 41% reduction in nitrogen load and 29% reduction in phosphorus load would need to come from controlling non-point sources of pollution like agricultural runoff.
Iowa State University was tasked with answering the question: “based on what we know about the performance of various conservation practices, how would it be possible to achieve these goals?” The answer was “only with a combination of practices, and only if every farm uses at least one of them.” This research began in 2010, using data about land use and farming practices from the previous five years (2006-2010), so the load reduction scenarios are relative to that “benchmark” period. The researchers later issued a supplemental report to compare the benchmark period to the baseline. Phosphorus went down due to changes in tillage but nitrogen went up due to an increase in corn and soybean acres and an increase in fertilizer application rates.
Using the information in ISU’s reports and dashboards, I’ve attempted to summarize our progress relative to both the baseline period (before the formation of the Hypoxia Action Task Force) and the benchmark period (before work began on the Iowa Nutrient Reduction Strategy).
Modeling vs. Monitoring
As I said, these are best-case scenarios. While we can certainly expect a big reduction in phosphorus pollution from the growth of no-till and cover crops, ultimately, the only way to be sure that water quality is improving in our rivers is to test it! If there’s a discrepancy between what you expect (a big reduction in phosphorus load) and what you measure (no clear trend in flow-weighted, five-year-moving-average phosphorus loads) that’s a sign that you left something important out of the spreadsheet! The most likely suspects are legacy sediment in the river valleys and livestock manure.
On the other hand, if your water quality data is incomplete or inconclusive or just hard to explain, it’s worth stepping back and asking yourself: “how big a reduction in nitrogen can I reasonably expect, based on the conservation practices installed so far?” If the answer is “1 or 2 percent,” there’s no need to wait for the results of a long-term study to acknowledge that your strategy isn’t working.
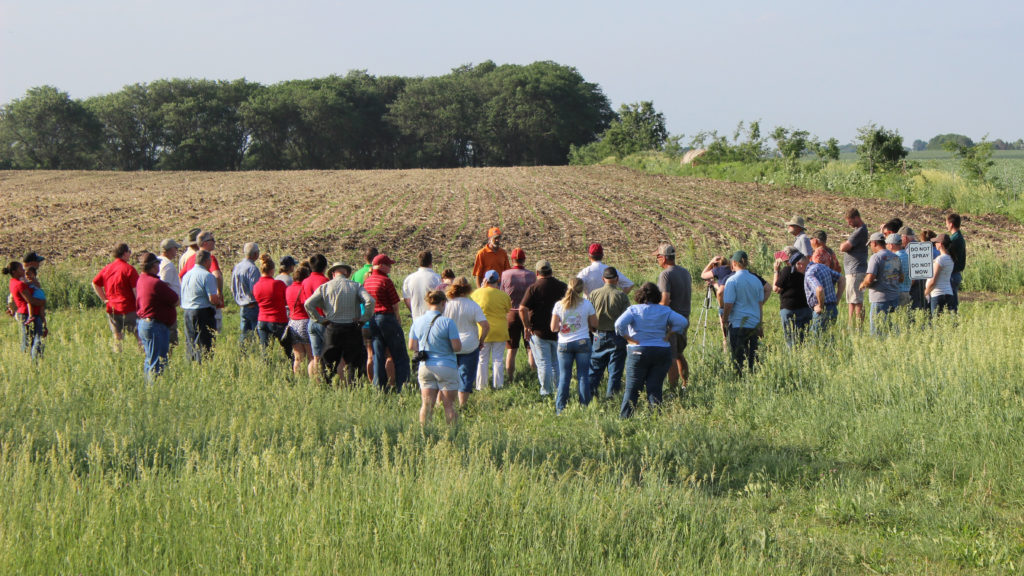
I remember doing that kind of reality check in 2019 for the Ioway Creek Watershed Management Authority, at the end of a four-year demonstration project. I did not enjoy being the bearer of bad news then, and I’m not enjoying it now. I remember how much work my colleagues put into those field days, and the ingenuity and vision displayed by the farmers who hosted them. I was there when the woodchips were poured into the first bioreactor in Boone County. So I totally understand the impulse to brag that Iowa now has 300 bioreactors, 3.8 million acres of cover crops, and 10.2 million acres of no-till. Many people worked hard to achieve those numbers! It is real progress! It’s kept nutrients and sediment out the water! It proves that there are many farmers who care about soil and water and are doing something about it! But it doesn’t prove that the Iowa Nutrient Reduction Strategy is working. For nitrogen, it definitely isn’t.
Conservation efforts have been partially offset by increased fertilizer use
I knew that we needed a lot more cover crops, wetlands, and saturated buffers to reach our nitrogen goal. Iowa Environmental Council has made this point with infographics. What I didn’t realize was the extent to which increases in fertilizer application rates have offset the hard-won gains that we’ve achieved so far.
Nutrient rate management was supposed to be the low-hanging fruit the Iowa Nutrient Reduction Strategy. At the time the INRS was written, the Maximum Return to Nitrogen (the point at which the yield bump from an additional pound of fertilizer doesn’t generate enough revenue to cover the costs) was 133 lbs/acre for corn in rotation and 190 lbs/acre for continuous corn. Reducing rates from 150 lbs/acre for corn in rotation and 201 lbs/acre seemed like an easy way to reduce nitrogen in the rivers by 10% while actually saving farmers money. Win-win! Instead, rates for corn in rotation averaged 173 pounds/acre for the past several years, which would raise nitrate levels in tile water by 18%! Rates for continuous corn went down just a tiny bit, to 199 lbs/acre. What happened?
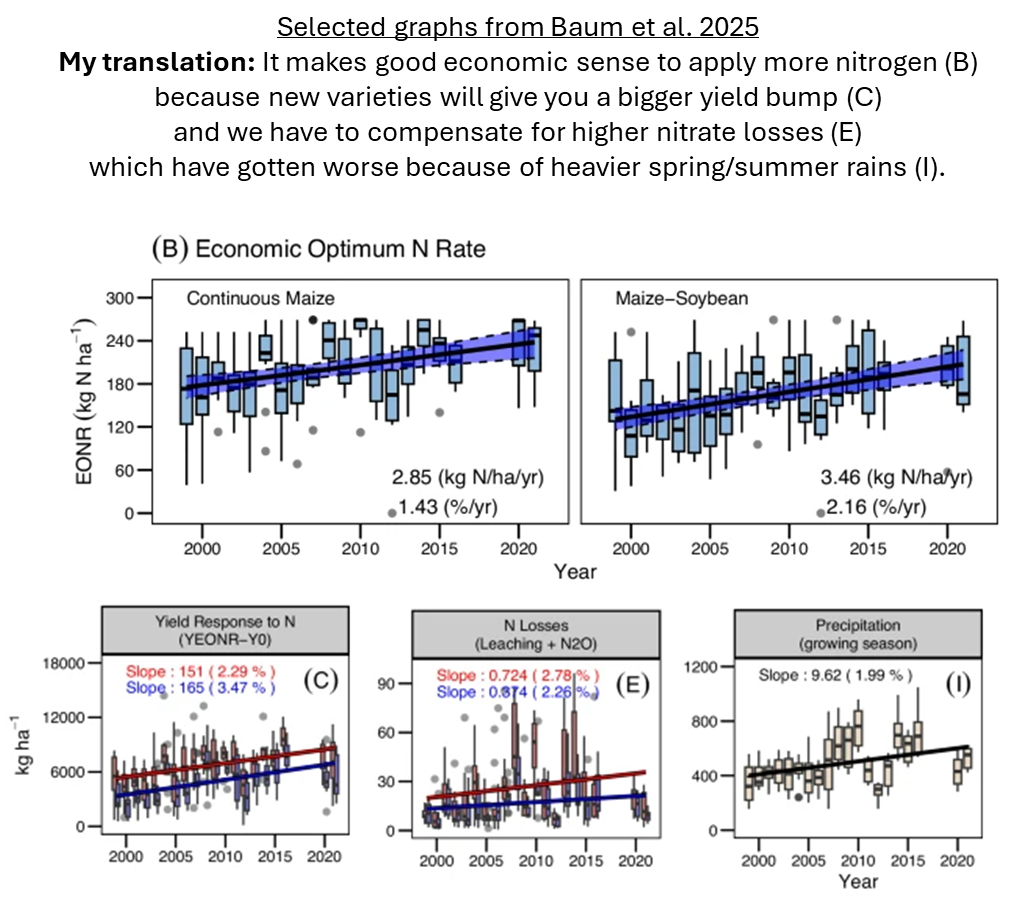
Several of the authors of the INRS science assessment just co-authored a new paper in Nature Communications which provides an answer. 133 lbs/acre was economically optimal under outdated assumptions about corn genetics and yield response, fertilizer and corn prices, and precipitation. Factoring all that in, the optimal rate for corn in rotation actually rose to 187 pounds/acre in 2020, leaving no opportunity for a win-win. Farmers are acting in their rational economic self-interest and applying as much nitrogen as is required to get good crop yields after a heavy spring rain. (Huge caveat: this doesn’t factor in manure). The researchers acknowledged that this is bad for water quality, as measured by a growing gap between the economically optimal rate and an “environmentally optimal rate” with some externalities priced in. Another way to say that: the fraction of agribusiness profits which come at the expense of other industries (i.e. commercial fishing in the Gulf, tourism for communities on polluted lakes) and the public (i.e. utility bills for customers of the Des Moines Waterworks, hospital bills for cancer patients) has been growing.
The companion piece to this paper is a new calculator. N-FACT uses data from on-farm nitrogen rate trials to factor in location, planting date, residual soil nitrogen, fertilizer price, and your best guess about corn prices and rainfall to provide a customized economically optimal nitrogen rate. The research that went into it is very impressive, and gave me a new appreciation all the factors that can influence agronomists’ recommendations and farmers’ decisions. I hope it will lead to reduced nitrogen losses by helping farmers improve their forecasting, but unless you’re doing a split application and soil or corn stalk testing, it seems like there’s still a lot uncertainty. That’s why I’m more excited about Practical Farmers of Iowa N Rate Protection Program, which directly addresses uncertainty and risk.
What we really need is a calculator to answer the following questions about the Iowa Nutrient Reduction Strategy:
- How much voluntary conservation will it take to offset future profit-driven changes in the industry?
- How soon can we expect to see meaningful reductions in nitrate in our rivers and drinking water?
- How many people will get preventable cancers in the meantime?
- How long is the public going to put up with this before we demand a change in strategy?
What do I mean by “a change in strategy?” Making policy recommendations isn’t our wheelhouse, but if you’re looking for ideas, you might start with this 2020 op-ed by Matt Liebman, Silvia Secchi, Chris Jones, and Neil Hamilton, or this 2022 report by the Iowa Environmental Council.
by Dan Haug | Jun 26, 2022
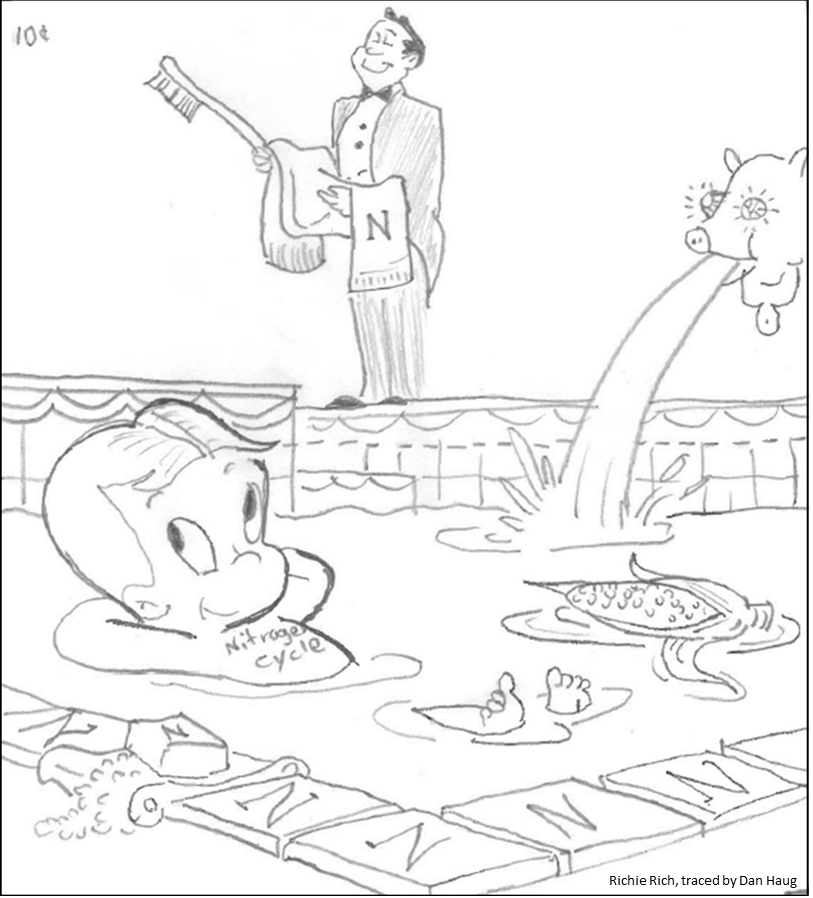
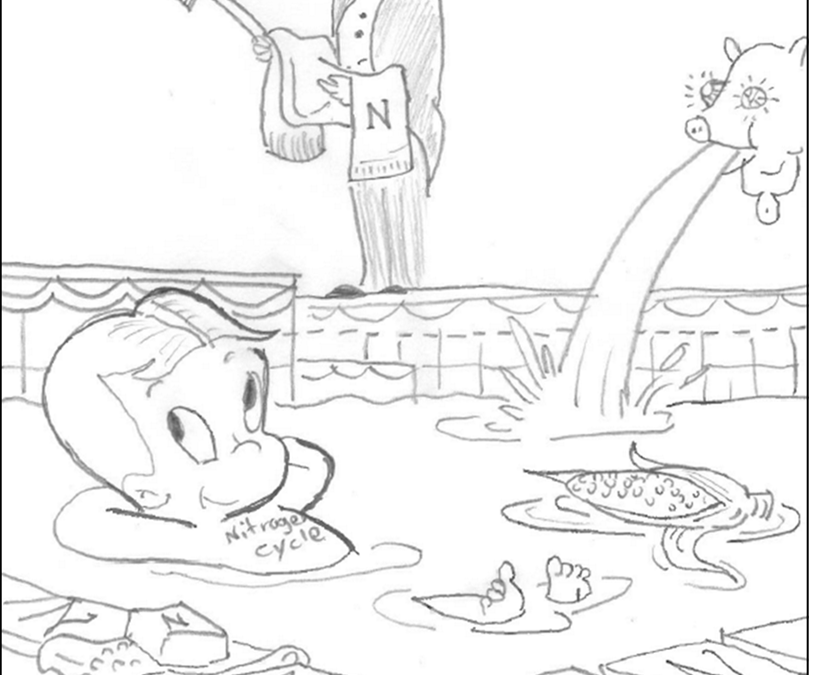
Imagine the nitrogen cycle is a trust fund kid with a gambling problem.
The young man (a corn field) is very rich (has rich black soil) but the money (nitrogen) he inherited from his father (the prairie) is locked in a trust fund (soil organic matter). Only a small portion of the funds are released to him each year (mineralized) following a complicated schedule determined by the trustees (microbes in the soil). In order to maintain the lifestyle to which he has become accustomed (provide enough nitrogen to the crop for good yields), he needs supplemental income (nitrogen from commercial fertilizer or manure). His sister (a soybean field) does not need to work (apply fertilizer) because she can borrow money from her well-connected husband (symbiotic nitrogen-fixing bacteria) but she also receives payments from the trust (mineralization). She helps her brother out (corn needs less nitrogen fertilizer following soybeans) but not directly (soybeans actually use more nitrogen than they fix, so the benefits of the rotation has more to do with the behavior of the residue and disrupting corn pests).
Both siblings have a gambling (water quality) problem and are terrible poker players. Whenever they’re feeling flush with cash (when other forms of nitrogen have been converted to nitrate) they blow some of it playing cards (nitrate easily leaches out of the root zone when it rains), but the extent of the losses vary and debts aren’t always collected right away (nitrate leached out of the root zone may not immediately reach streams). They struggle with temptation more than their cousins (alfalfa and small grains) because they come from a broken home (the soil is fallow for large parts of the year) and because bills and income don’t arrive at the same time (there is a mismatch between the timing of maximum nitrogen and water availability and crop nitrogen and water use).
“”Okay, Dan, that’s very clever, but what’s your point?
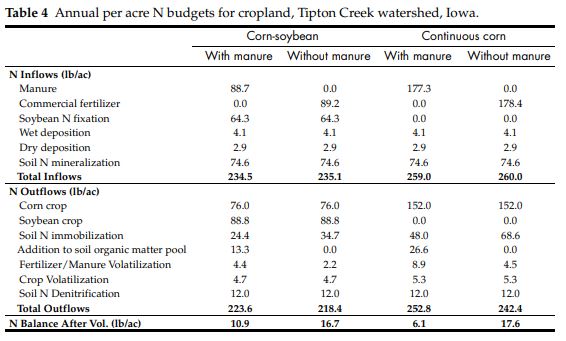
Well, having compared the soil to a trust fund, I can now say “don’t confuse net worth with income.” You’ve probably heard that there 10,000 pounds per acre of nitrogen stored in a rich Iowa soil. That’s true but misleading. The amount actually released each year by decomposing organic matter (net mineralization) is only a few percent of that, comparable in size and importance to fertilizer or manure. Here’s an example nitrogen budget.
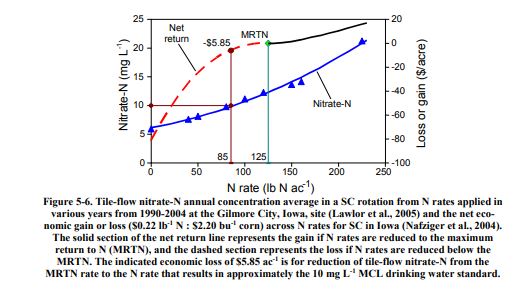
On average and over the long-term, we know that fields and watersheds with higher nitrogen applications (taking into account both manure and commercial fertilizer) leach more nitrate into the water. On average and over the long-term, we know that that farmers can profit by reducing their application rate to the Maximum Return To Nitrogen (the point at which another pound of nitrogen does not produce a big enough yield bump to offset the fertilizer costs). Right now, with corn prices high but fertilizer prices going nuts, the MRTN is 136 pounds per acre for corn following soybeans, while in the most recent survey I could find, farmers reported applying an average of 172 pounds per acre. So there’s room to save money while improving water quality!
But having compared nitrate leaching to gambling, I can also say “don’t confuse a balance sheet problem with a cash flow problem.” In any given year, it’s always a gamble how much of the nitrogen that’s applied will be washed away and how much will be available to the crop. Maybe some farmers are passing up on an opportunity to increase their profits because they’re not comfortable with the short-term risks.
Farmers say that extra nitrogen is cheap insurance. If that’s true, maybe we need crop insurance that makes it easier to do the right thing, not a more precise calculator.
by Dan Haug | Oct 9, 2019
Nitrogen rate management (MRTN) is the low-hanging fruit of the Iowa Nutrient Reduction Strategy, a win-win for profitability and the environment. On closer inspection, that fruit is even juicier than we thought; but harder to reach.
Here’s the paradox of nutrient management that the general public fails to grasp. We don’t know with any certainty at application time how much nitrogen the corn crop will need or how much nitrogen will be left in the soil come July when the crop starts maturing. Corn stalk nitrogen tests and split applications can improve the accuracy of the guess, but farmers still have to guess. If they guess too low, they lose income. So most farmers err on the high side, which means that (all else being equal) more nitrogen will end up in our streams.

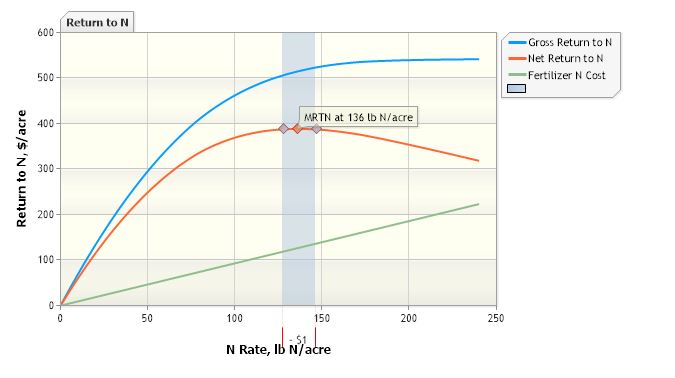
Figure by John Sawyer at ISU. The economically optimum nitrogen rate varies by year, even on the same field.
We may not know what’s the right amount of nitrogen to apply this year, but we can pinpoint a range that makes the most economic sense across sites and years. In 2005, Iowa State University researchers crunched the numbers and developed an online calculator. A farmer can enter current prices for corn and fertilizer to get the Maximum Return To Nitrogen (MRTN). Above that range, they might get a bit higher yield, but the revenue from those extra bushels doesn’t offset the cost of the extra nitrogen. Applying nitrogen at the MRTN is a rare win-win for profitability and the environment.
Along with cover crops, wetlands, and bioreactors, MRTN was one of the more promising practices for nitrogen outlined in the Iowa Nutrient Reduction Strategy. Still, the authors cautioned that it wouldn’t get us very far by itself. An average field would cut nitrate losses by 10 percent. Since some parts of the state apply less nitrogen than others, universal adoption of this practice would get us a 9 percent reduction in nitrate concentrations.

That modest reduction assumes Iowa farmers currently apply 150 lbs of N/acre on a corn-bean rotation and 190 lbs/acre on continuous corn, a figure the authors admitted were “possibly outdated.” A 2017 survey by ag retailers found that Iowa farmers apply 169 lbs/acre of nitrogen on corn after beans and apply 210 lbs N/acre on continuous corn. I updated Dr. Helmers graph with those numbers and an MRTN based on current corn and nitrogen prices to determine the potential water quality benefit. This low-hanging fruit is juicier than we thought!

And that’s just the average! Inspired by a recent essay by Chris Jones, I read a manure management plan for a field in one of our watersheds. It receives 190 lbs/acre of nitrogen and 146 lbs/acre of phosphorus in the form of liquid swine manure. If that manure could be spread over more acres at a rate of 140 lbs/acre, that could reduce nitrate losses by 31%. If it replaces rather than supplements commercial fertilizer, we could get another 4% cut in nitrate. Manure is a slow-release fertilizer and less susceptible to leaching.

Is that economical? Hard to say. Daniel Anderson reports that liquid swine manure can be moved seven miles and still be cheaper than synthetic fertilizer. In Story and Boone County that might work. Hamilton County has 218 manure management plans, so I’m not sure how far you’d need to travel to find a field not already being treated. Are there changes in processing or additional cost share that would help make it more feasible? I don’t know. No-one is talking about it. But cover crops work equally well. Winter rye grows thicker with fall-applied manure and can scavenge nitrogen that would otherwise be lost.
Unfortunately, neither of those options (MRTN or cover crops) are even suggested as part of manure management plans and the loudest voices in the room are saying livestock producers don’t need to be doing anything differently. Until that situation changes, the widespread adoption of rate management that’s assumed in statewide and watershed-based scenarios won’t happen and we will fail to meet our nutrient reduction goals.
by Dan Haug | Mar 27, 2019

Several of our staff attended the Iowa Water Conference on March 12 and 13. The event brings together hundreds of smart, hard-working people that are working to improve water quality, restore aquatic habitat, and control flooding across the state of Iowa. We always learn a lot from both the presenters and the other attendees, and come away energized. Here are our top three lessons we learned this year:
1. Farms can simultaneously improve water quality and wildlife habitat
Adam Janke, Extension Wildlife Specialist, talked about how the practices being used for nutrient reduction can also benefit many of Iowa’s species of greatest conservation need. For example, trumpeter swans like CREP wetlands. Migrating ringneck ducks and Topeka shiners use oxbow wetlands. Meadowlarks use prairie strips. We will be pursuing these kinds of synergies in three watersheds with a National Fish and Wildlife Foundation grant, so it was great to hear specifics.
2. Retailers of agricultural products need to be part of water quality solutions
Chris Jones from University of Iowa shared some disturbing data from northwest Iowa. In the Floyd and Rock River watersheds, livestock production and manure application has doubled since 1980, but commercial fertilizer sales have remained the same. In those watersheds, nitrogen is being applied at 80-100 lbs/acre above the MRTN (Maximum Return to Nitrogen), leading to nitrate concentrations in the Floyd and Rock rivers that are twice as high as other streams in western Iowa. Clearly, some farmers aren’t thinking about their manure management plan or water quality when they purchase nitrogen fertilizer, and their retailers aren’t bringing it up. When our conversations about agriculture remain siloed (pardon the pun), water quality suffers.
However, at another session, we learned how ag retailers with the Agriculture’s Clean Water Alliance are showing leadership on water quality — including water quality monitoring in the Raccoon River and developing a code of practice for nitrogen application to reduce losses from farm fields while increasing return on investment (ROI). Precision agriculture tools are also being used to identify land where inputs aren’t generating a good ROI, and use that information to make conservation decisions that benefit both the bottom line and the environment. Gregg Schmitz of Nutrien shared an example where revenues from a 140 acre farm were increased by putting 70 acres into CRP and redeploying inputs into the other half. Surveys show that agriculture retailers and crop consultants are trusted sources of information for farmers, so their involvement will be essential to solving our water quality challenges. We’re grateful for the support of Key Cooperative and Heartland Cooperative on field days and producer engagement in the Squaw Creek watershed.
3. Water quality improvements are possible, but require a commitment of both time and money
Neil Shaffer, an award-winning watershed coordinator in northeast Iowa, shared some heartening success stories. Nitrate leaving the Staff Creek and Beaver Creek watershed was reduced by 47%. Brook trout were reintroduced to a tributary of Silver Creek. In both cases, it took over 8 years of monitoring and $3-5 million of funding for conservation practices to see those changes. We’re well aware that water quality requires a long-term commitment and are in this for the long haul.


