Think Outside the HUCs
“With the Nutrient Reduction Strategy approaching its 10-year anniversary in 2023, Iowans deserve to see water quality results from the nearly $100 million of public money invested since 2013. Water monitoring is a crucial component to the success of the Nutrient Reduction Strategy and must be designed to assess progress. A strategy without a way to evaluate progress or outcomes is not a real strategy.”
– from Iowa Environmental Council’s 2022 report: “Water Quality Monitoring and the Water Quality Initiative“
Most water monitoring programs are NOT designed to assess progress. Often, people don’t begin monitoring in earnest until the grant funding arrives for an improvement project (or on flip side, until an industry with a reputation for pollution sets up shop in the area). Often, they’re hoping for preliminary results when the grant wraps in 3-5 years. I’ve been down that road, completed a horrifying statistical analysis, and left this conference poster as a warning to others: “Progress tracking is not a realistic use for typical stream monitoring approaches”.
Our local partners in Story County took this warning to heart and made a plan to sustain water monitoring for at least ten years, while shifting our focus. We collected lab samples from more sites (less often, and with less hassle) while ramping up the volunteer program, so we could engage the public and get a baseline understanding of water bodies all around the county. All is well and good. But now and then I come back to the question “how would you monitor water if you were serious about assessing progress?”.
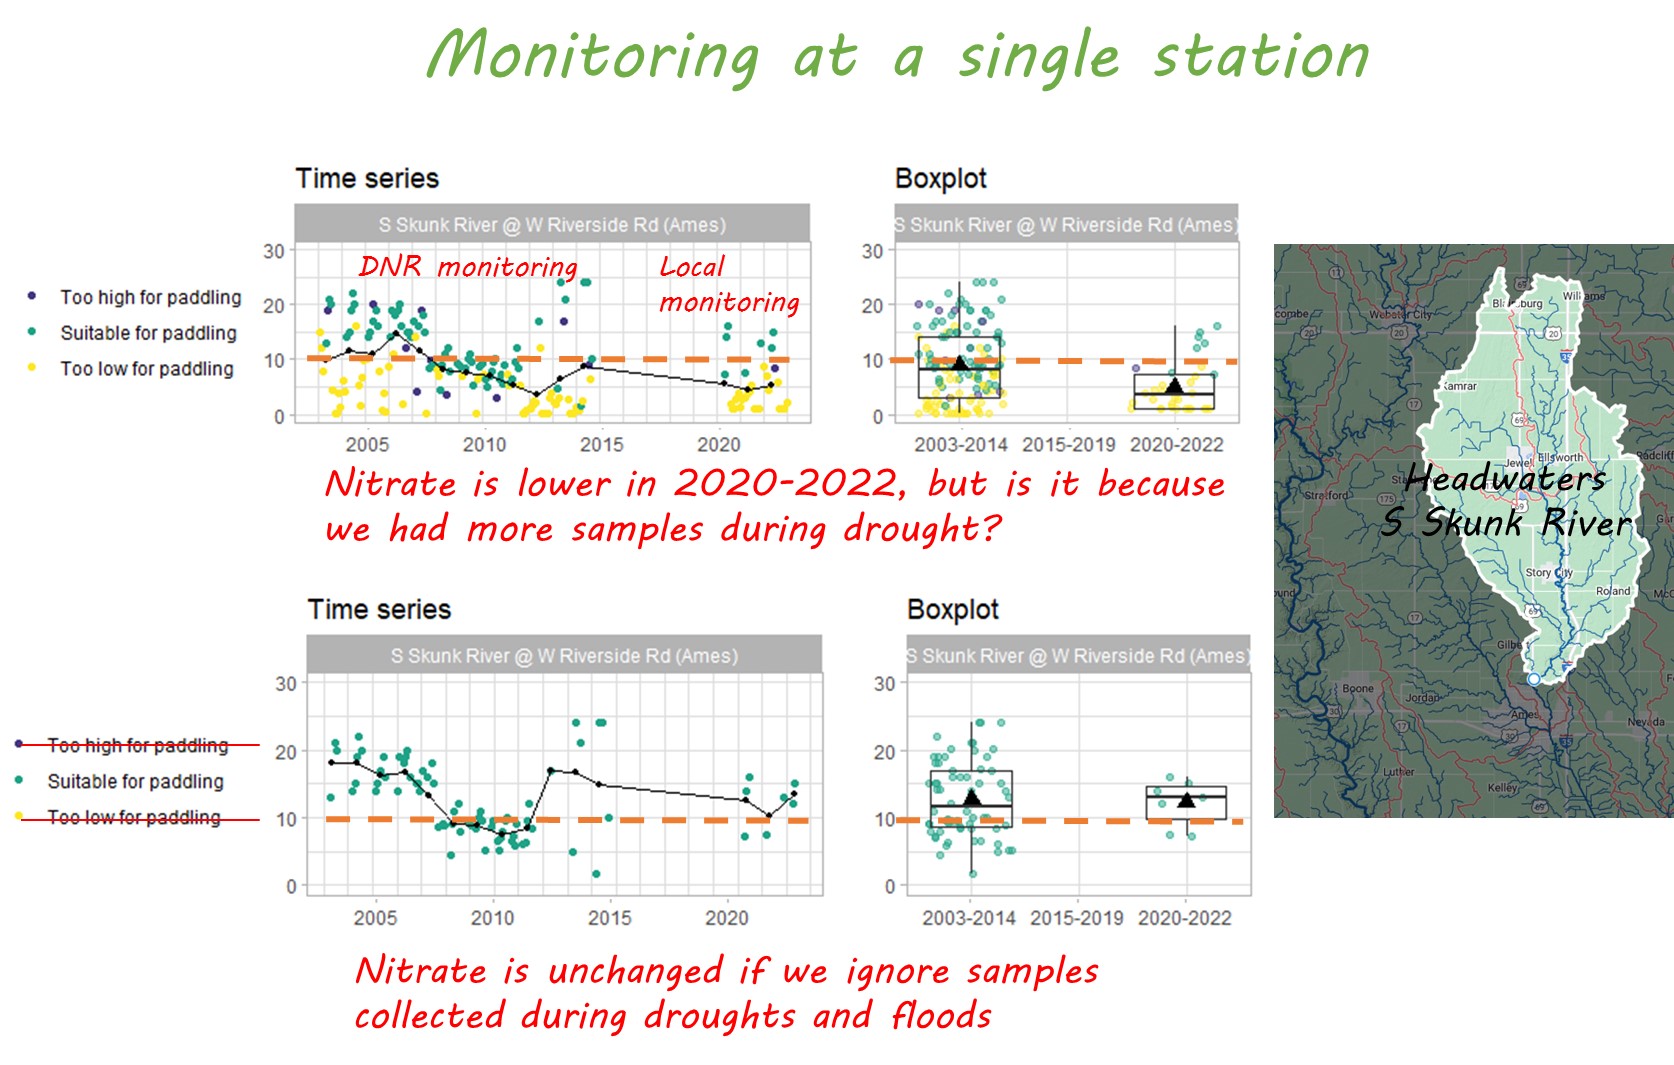
Preliminary results in 3-5 years might be feasible if you already have baseline data for comparison, and account for any big changes in weather. The South Skunk River just upstream of Ames was monitored from 2001-2014 by the Iowa DNR, and we resumed monitoring it in 2020. I have good news and bad news for the newly formed Headwaters of the South Skunk River WMA.
- Good news: average nitrate concentrations over the last three years have declined 46% compared to the baseline period. Mission accomplished?
- Bad news: the trend goes away if you exclude samples collected during a drought when nitrate levels are at their lowest.
Study design is key for progress tracking. In order to be sure that water quality really changed, and to be able to link that change to something that happened in the watershed, scientists approach water monitoring like a medical trial. To do it right, there should be a treatment group (a watershed that receives conservation funding and attention), a control group (a nearby watershed that doesn’t receive funding), a before period, and an after period. There should be a full accounting of land management and conservation practices in both watersheds. If the treatment group improves more than the control group, that’s a good sign the medicine works. At the time we wrote the Story County Monitoring Plan, doing a paired watershed study of the sort that Michelle Soupir did for Black Hawk Lake didn’t make a lot of sense.
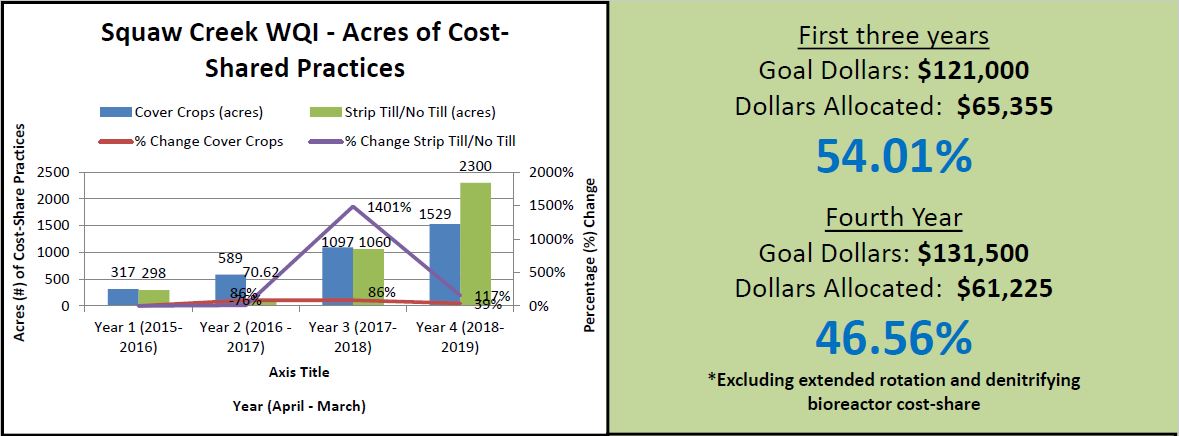
It didn’t make sense to invest in progress tracking, because our WQI-funded watershed project had come to a close, further funding was uncertain, and we couldn’t expect much improvement in water quality based on other metrics to date. Our watershed coordinators worked really hard, we had enthusiastic partners in local government and agribusiness, and we organized some well-attended field days where we heard from inspiring early adopters of cover crops and bioreactors. We met some farmers in the watershed who cared enough about soil and water to take a risk and try something new. Unfortunately, at the end of four years, we had a lot of unspent cost share funds and only enough conservation practices to expect or 1 or 2 percent reduction in nitrogen and phosphorus. Ioway Creek is a big watershed (147,000 acres).
However, this year I was reviewing our water monitoring data and had one of those moments like when you squint at an optical illusion and suddenly see a rabbit instead of a duck.
“Hey, that looks a lot like an upstream/downstream study for tracking whether projects in the Ioway Creek watershed and the City of Ames have improved water quality!”
- The medicine: A bunch of conservation practices were installed between 2015 and 2019, some of which address nitrogen and some of which address other pollutants. We could include Jean’s no-till fields in Hamilton County, Jeremy’s cover crops in Boone County, Gerold’s bioreactor in Boone County, the UV disinfection system in Gilbert, the permeable parking lot at Ames City Hall, the stream restoration and saturated buffer at the Tedesco Environmental Learning Corridor, and many others.
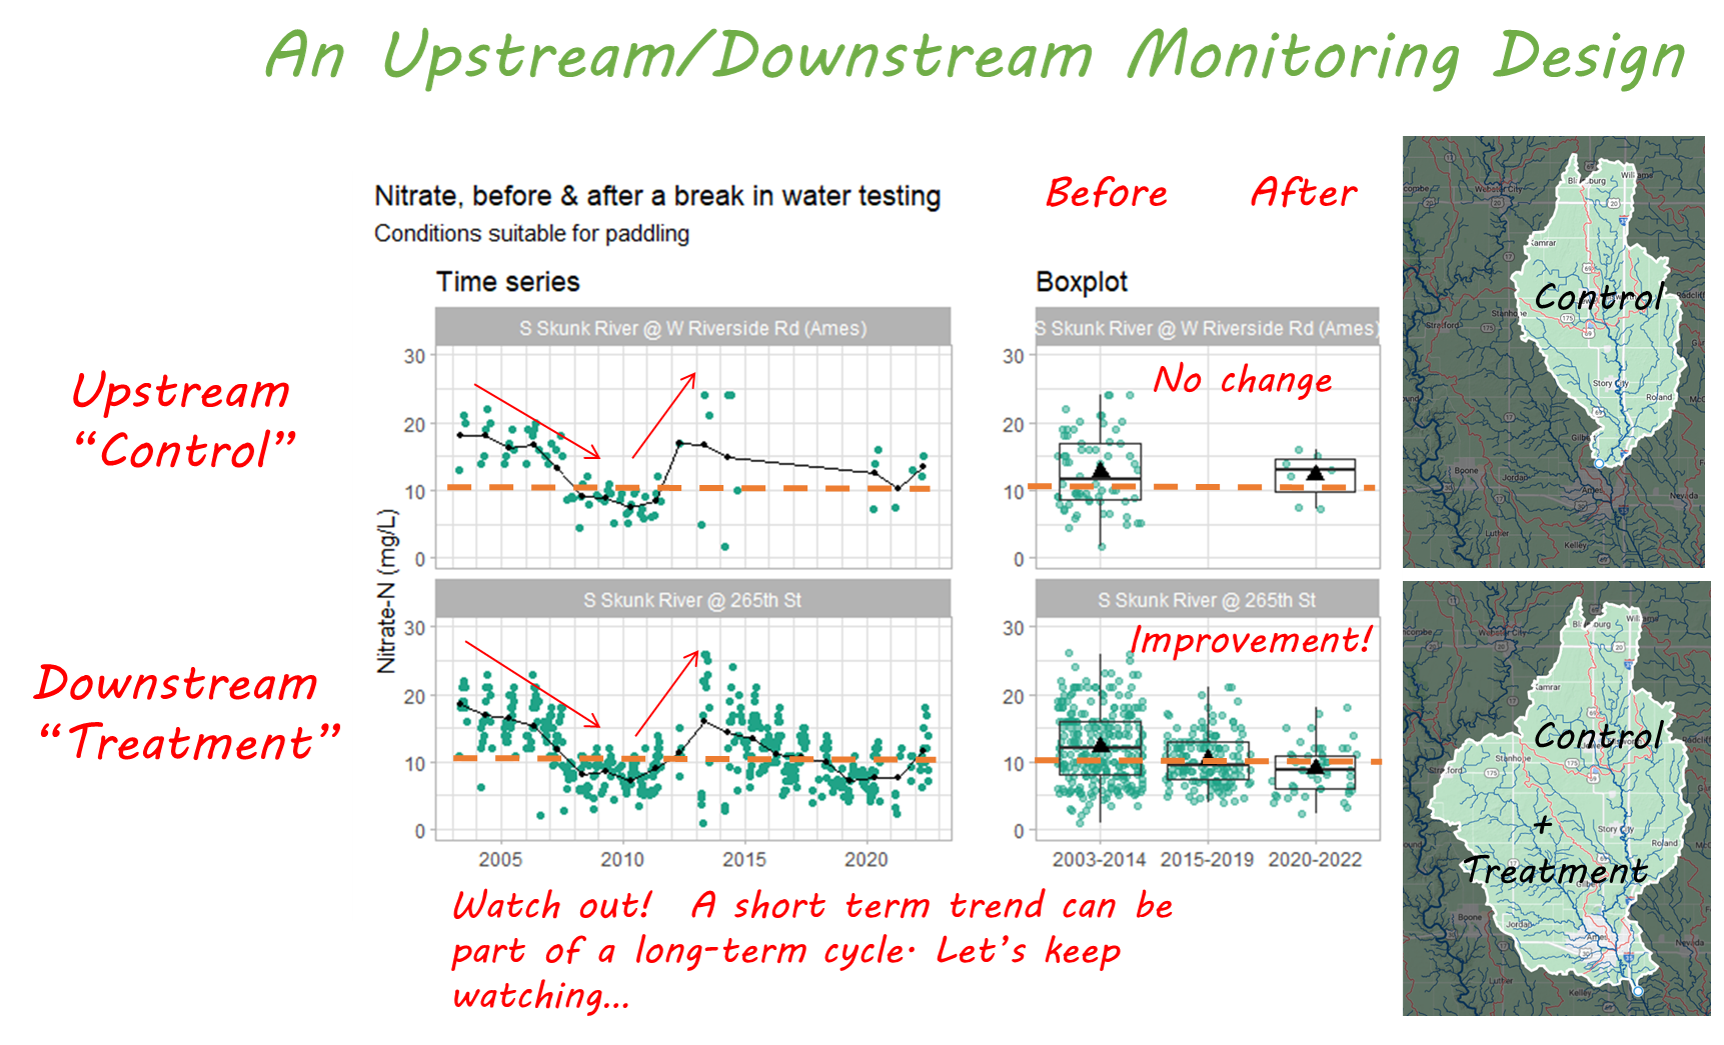
- The treatment group: A downstream site, influenced by all those conservation practices. The South Skunk River at 265th St. has been monitored weekly by the City of Ames since 2003. At this point the river drains 573 square miles, corresponding to the Ioway Creek watershed plus the Headwaters of the South Skunk River watershed.
- The control group: An upstream site, not influenced by these practices. At this point, the river drains 316 square miles, corresponding to the Headwaters of the South Skunk River watershed, minus any land within Ames city limits.
- A before period: Both sites were monitored between 2003 and 2014.
- An after period: Both sites were monitored between 2020 and 2022.
And then I made a boxplot and squinted a little more and said, “Hey, it looks a lot like nitrate has improved at the downstream site!” Same thing for E. coli! Maybe there’s more to this story than just cost-share metrics.
The analysis is described in more detail in our 2022 annual report on water monitoring in Story County. We’ll also have some opportunities this year to talk with other groups around the state that are doing water quality monitoring and swap some tips and tricks.
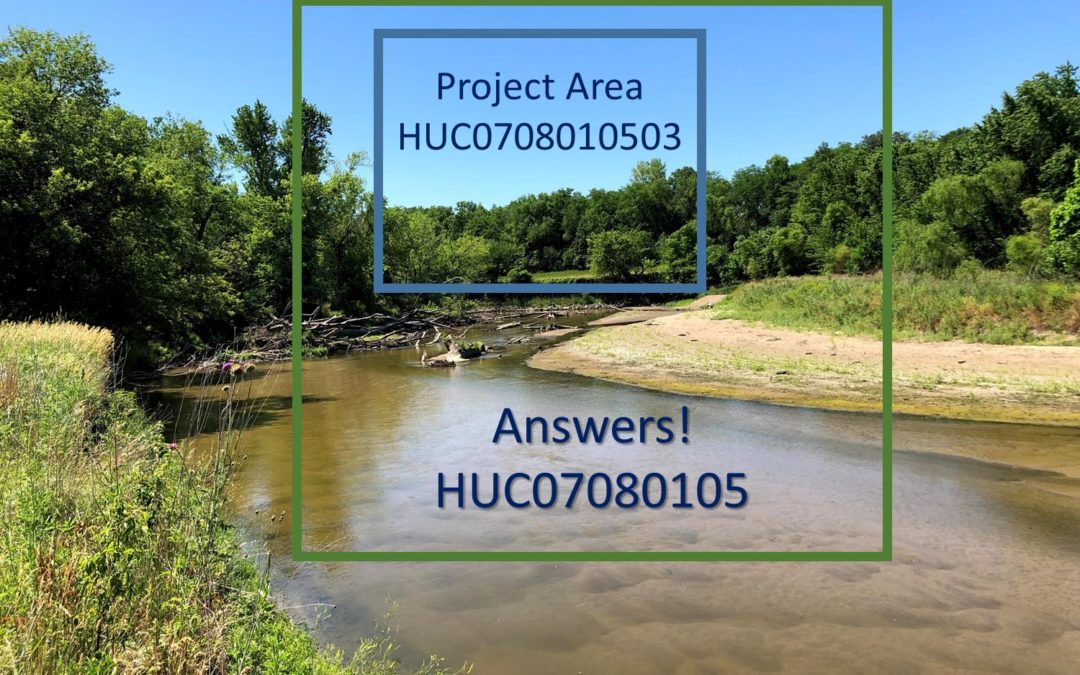
Here’s one of mine. To see the “rabbit” in this data, you have to be flexible in how you think about watersheds. A watershed is just the land area that drains to a common point. With the right tools, we can delineate a watershed for any point of interest on the river network. I’ve taught several classes of ninth graders how to do this. Neither of these sites are in the Ioway Creek watershed, and they aren’t mentioned in the Watershed Plan, but that doesn’t mean they’re not relevant. The US Geologic Survey’s system for mapping and numbering watersheds is convenient for many purposes. But if you have access to long-term monitoring data, don’t be afraid to think outside the HUCs!

