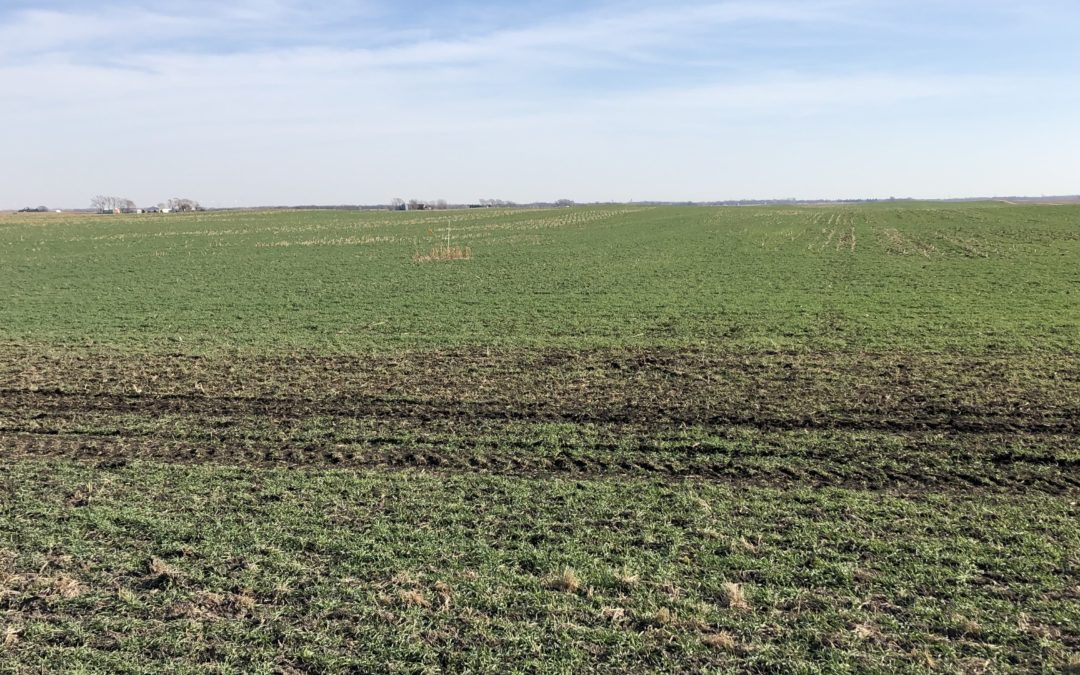
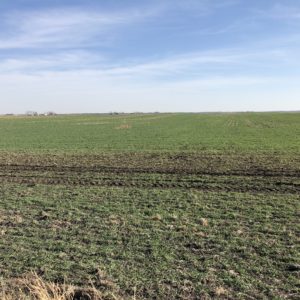
Nice looking rye cover crop near Nevada, IA November 2020
A big thank you to farmers who planted cover crops after this challenging year. Cover crops will hold soil and nutrients in place through the winter and early spring. That could be especially important this year.
After a drought, nitrogen that might normally have been taken up by a high-yielding crop or flushed away by rainfall remains in the soil. That leftover nitrogen could be available for next year’s crop, but only if:
A) we have a dry spring, or
B) farmers have made use of practices like cover crops or nitrification inhibitors that prevent nitrogen losses during the fallow season.
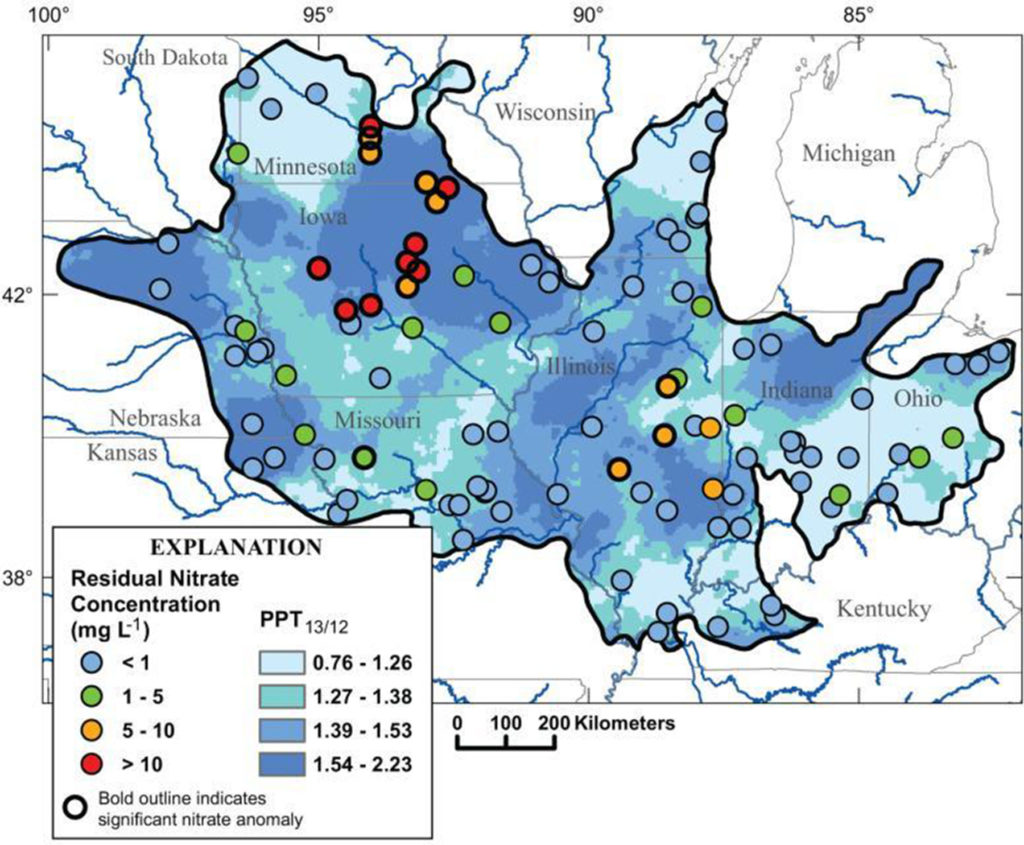
A wet year in 2013 following a dry year in 2012 (dark blue) caused nitrate concentrations in many central iowa streams to jump as much as 10 mg/L higher than usual (red). Figure from Van Metre et al. 2008
A drought in 2012 following by a wet spring in 2013 led to nitrate concentrations in excess of 20 mg/L in many rivers in Central Iowa. If we have a wet spring in 2021, we could see this happen again. As one scientific paper put it, “weather whiplash drives deterioration of water quality.”
“Weather whiplash” can also help explain the long-term trends I’ve been seeing in the South Skunk River and its tributaries: a decline in nitrate concentrations from 2005-2012, a big jump in 2013, and another decline over the past 7 years. I’ll walk you through my analysis.
Explaining nitrate concentrations in the South Skunk River
Technical details, feel free to skip: This data was collected by the City of Ames just upstream of wastewater treatment plant. The City has monitored the South Skunk River above and below its wastewater treatment plant almost every week since 2003! Flow is measured continuously at a few miles upstream USGS gage near S. 16th St. I’ve summarized nitrate concentrations and streamflow by season (Jan-Mar, Apr-Jun, Jul-Sep, Oct-Dec). At each step of the way, I apply a linear regression equation and graph the model residuals. Taken together, these three factors explain 59% of the variation. The effects of “weather whiplash” may extend beyond one year, since nitrate from some parts of the field may travel more slowly to streams via groundwater.
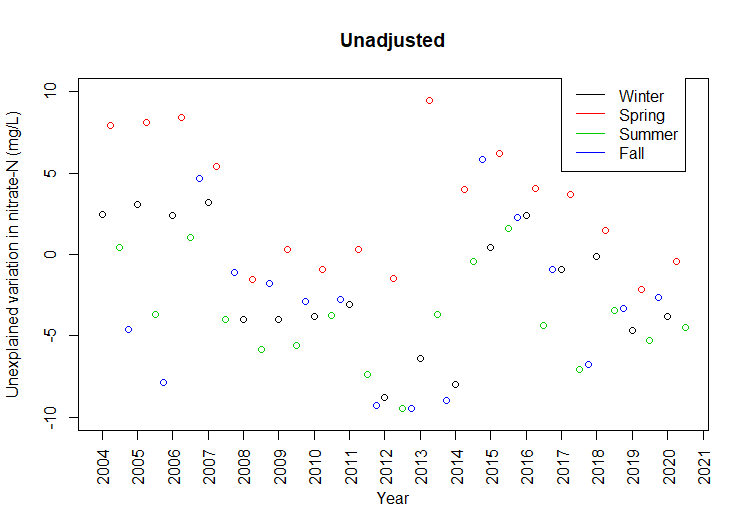
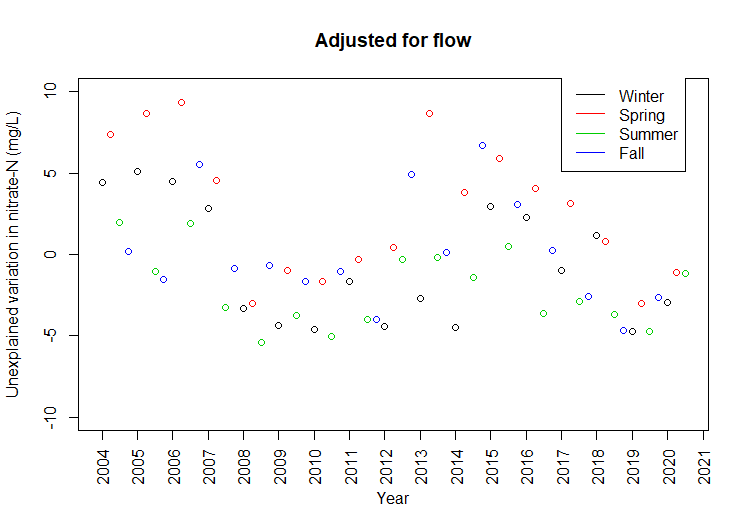
In a given quarter, nitrate concentrations in the South Skunk can be up to 10 mg/L higher than the long-term average, or as much as 10 mg/L lower. The following graphs show how much variation is left to explain after correcting for current weather, last year’s weather, and season.
Nitrate in the South Skunk is again declining after a sudden increase in 2013.Low-flow conditions in 2011-2013 explain unusually low nitrate concentrations.
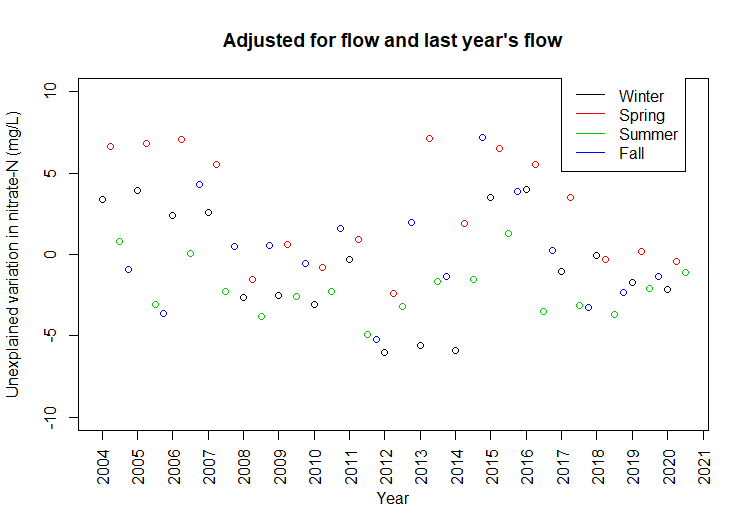
Wet springs following dry years explain unusually high nitrate concentrations.Seasonal patterns explain some of the remaining variation.
The lowest nitrate concentrations can be explained by streamflow: when the weather is dry and tiles aren’t flowing, nitrate levels in rivers taper off to the background levels seen in groundwater.
The highest nitrate concentrations can be explained by weather over the previous 12 months: a wet period following a dry period will flush out nitrate that’s accumulated in the soil.
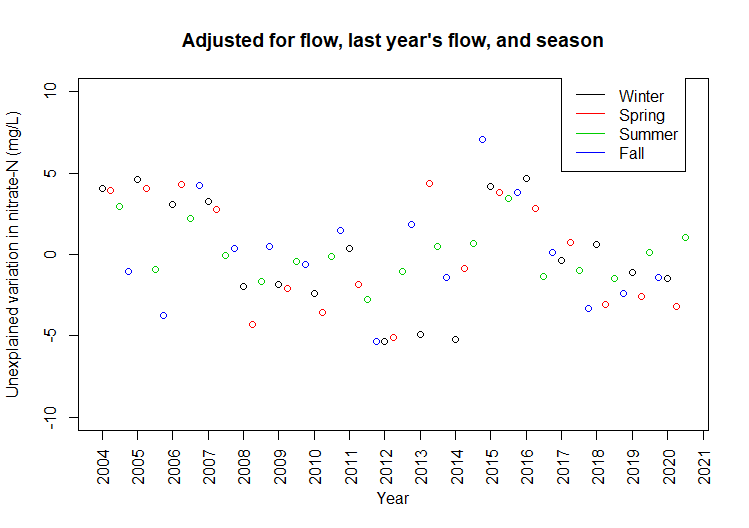
After that, there’s still a seasonal pattern independent of rainfall: nitrogen is most susceptible to loss in spring when soils are bare and microbial activity picks up (April-June) and least susceptible when the maturing crop is using up the available nitrogen (July-Sept).
Can some of the remaining pattern be explained by greater adoption of conservation practices in the watershed in the past 5 years? We hope so, but let’s see what happens next spring!
This post is part of a series for 2019 Watershed Awareness Month, comparing water quality in a pair of local creeks to learn how land and people influence water.
Clear Creek @Hyland on May 18
Clear Creek@ Hyland on May 24
Transparency > 60 cm
Transparency of 1 cm
Orthophosphate 0.1 mg/L
Orthophosphate 5 mg/L
Clear Creek was true to its name on May 18 when the Squaw Creek Watershed Coalition did its spring water quality snapshot. Long-time member Ed Engle and three Ames High School students (Wil, Becca, and Nate) filled a transparency tube to the top (60 cm) and the secchi disk at the bottom was clearly visible. A week later, Rick Dietz tested the same location after a 1.7 inch rainstorm and couldn’t see the disk until he’d poured out all but 1 cm of the water!
Phosphorus in Clear Creek was high enough we had to break out the high range comparison vials!
Water quality can change rapidly. Sediment* in the water spikes during and after a big rain storm. So does phosphorus and E. coli. Nitrate and chloride show strong seasonal patterns. While some of that variation may average out in a big dataset, when streams are sampled less often, it can be tricky to make an apples-to-apples comparison. That’s why water quality snapshots—multiple streams sampled on the same day—are so valuable.
*measured as clarity, turbidity, or total suspended solids
The Coalition has been monitoring Clear Creek since 2007. It normally has pretty good water quality, with orthophosphate near the outlet averaging 0.2 mg/L and transparency averaging 43 cm. 23% of the riparian area is forested (Pammel Woods, Munn Woods, and Emma McCarthy Lee Park) so that’s part of the reason. Another reason is the efforts of some farmers in the watershed. Jeremy Gustafson has been improving his soil and protecting water through his innovative use of cover crops–planting soybeans into living rye and using diverse mixes after oats.
Farmer Jeremy Gustafson shows members of the Squaw Creek Watershed Management board how cover crops have improved his soil.
Still, there’s room for improvement. Nitrate levels average 5.7 mg/L in Pammel Woods, and 7.5 mg/L at the Boone-Story county line. (For reference, nitrate was historically less than 2 mg/L). And as the “gully washer” of May 24 shows, the relatively flat “Des Moines Lobe” region of Iowa is not immune to soil erosion! More no-till, cover crops, and prairie strips could further reduce erosion. More sediment ponds, wetlands, and buffers could prevent sediment from reaching the creek.
A creek sign on the Lincoln Heritage Byway (Ontario Rd near the county line)! You can’t get more Prairie Rivers of Iowa than that! The creek was out of its banks.
Clear Creek, College Creek, and Worrell Creek all start in Boone County and join Squaw Creek in Ames. We’ll continue to support conservation practices in these watersheds through our Small Landowner Assistance project (wrapping up this year) and our National Fish and Wildlife Foundation grant (just getting going). If you live or farm west of Ames and are thinking about conservation, or know someone who does, give us a call!