Rain gardens are a stormwater management solution that’s simple enough to tackle as a DIY project: dig a shallow basin to intercept runoff from a downspout or paved area, plant it with ornamental grasses and flowers, and pat yourself on the back for doing your small part to prevent flash flooding, streambank erosion, and water pollution! However, I’ve noticed a few things that can go wrong. Here are some tips to avoid them!
These tips also apply to the bioretention cells you’ll see in public right-of-ways, which are similar, but have an underdrain and an engineered soil mix.
Standing Water
A rain garden may fill up with water after a heavy rain, but it should soak into the ground within 24 hours. This will prevent mosquitos from breeding and allow a wider variety of plants to thrive. To achieve this, you either need to find a spot with well-drained soil, or you need to amend the soil with sand and compost. It’s important to test the infiltration rate of the soil: a 6 inch deep rain garden would need soil that can infiltrate at least 0.25 inches of water per hour.
This bioretention cell has turned into a cattail marsh, with standing water for extended periods in the spring. I tested the soil for a school project and determined that the soil had too much clay content and had been compacted during construction.
Erosion and Debris
There are guidelines for how big to make a rain garden to handle the runoff from a given area. However, if space is limited, an undersized rain garden is better than no rain garden. The trick is to manage the overflow.
This rain garden treats the runoff from a church parking lot. Once the water level gets high enough, it enters a pipe that connects with the storm sewer. This pipe was installed in response to concerns about soil and mulch washing onto the sidewalk when water overtopped the berm. We installed a mesh barrier to keep woodchips from clogging the outlet. I’ve heard that shredded hardwood mulch is less prone to floating than wood chips and bark nuggets.
One other issue with this rain garden was erosion as water made its way from the pavement to the low point. To solve this problem, I regraded the basin so it had a level bottom (using a line level, rake, and shovel), and put some stones and gravel at the edge of the pavement to absorb the force of the water.
Dead plants and weeds
There are many lovely species of native plants that can thrive in a rain garden, once established, but as seedlings they may struggle to withstand alternating periods of flooding and drought. To improve their odds of success, you can redirect the downspout or plug the opening to the rain garden for a few months, irrigate, and protect them from rabbits and deer. If that’s not possible, expect to replace a few plants.
Just like any other garden, a rain garden can get overrun with weeds, especially when the desirable plants are just getting started. Sturdy labels or ID guides can help whoever is responsible for maintenance know what to pull and what to keep, but for a situation like this (a highly visible commercial right-of-way managed by the city) simpler planting plans are probably better.
I hope this article helps you avoid some common pitfalls but doesn’t discourage you from trying. I planted a rain garden in my backyard last spring and have already enjoyed some blooms and monarch butterflies!
This letter is a satire of DNR’s latest response to the EPA’s partial disapproval of Iowa’s 2024 Impaired Waters List. My first impression was that this was a technical dispute with low stakes for water quality and industry. In theory, adding waters to the 303(d) list can result in stricter permit limits on point sources and open up grants for non-point source projects, but in practice there are many loopholes and backlogs that make that unlikely. However, it still matters whether Iowans are getting honest information about the condition of our waters from the agency charged with protecting them. Iowa DNR’s position is ridiculous and indefensible.
To the attention of the US Environmental Protection Agency, Region 7:
Dear Sir,
In your November letter, you stated that Iowa’s 2024 Impaired Waters List should have included six more river segments that are too polluted by nitrate to fully support drinking water uses. The Iowa Department of Natural Resources strongly disagrees and objects to the implication that Iowa’s water is unsafe, or that DNR is not meeting the letter or the spirit of the Clean Water Act.
Just to be clear, we’re not talking about whether the water is safe for fish or swimming. Toxic algae blooms are a separate issue, for which nitrate is at most a contributing factor. Okay, good we’re on the same page. It’s impossible for most waters to end up on the 303(d) list because of nitrogen or phosphorus pollution, because we still haven’t set numeric criteria to protect aquatic life. The 10 mg/L standard for nitrate applies only to the 61 reservoirs and 18 stretches of river that were designated Class C waters, because they are currently or were historically used as a major source of drinking water.
Ultimately, the goal of EPA and DNR is the same: to ensure that Iowa’s drinking water is safe. It is safe! Well… maybe not for adults. We have the second highest cancer rate in the nation and there is growing evidence that one of the risk factors is long-term exposure to moderate levels of nitrate in drinking water. But nobody is seriously proposing we do anything about that! The issue here is whether tap water is safe for babies, whether nitrate-nitrogen is below the Maximum Contaminant Level of 10 mg/L, as required by the Safe Drinking Water Act.
I’m happy to say that water utilities on these six rivers have been able meet that standard by either:
Mixing high-nitrate river water with low-nitrate water from wells and reservoirs
Asking customers to cut back on water use during times when the reservoir has a toxic algae bloom
Drilling enough wells so they no longer have to use any river water
What, you don’t think giving up on polluted rivers is consistent with the spirit of the Clean Water Act? Hey, if it works… Oskaloosa switched its water source from surface water to an alluvial aquifer years ago, and those wells usually have low nitrate levels. That means that even though we’re still legally required to assess nitrate in the South Skunk River, we no longer have any practical reason to worry about it! Granted, alluvial aquifers are still susceptible to contamination from the adjacent river. Cedar Rapids recently saw nitrate in their wells rise to 9 mg/L, but we’re crossing our fingers that it doesn’t get worse.
Let’s get back to the main issue under dispute. We’re not talking about water quality in 2024, we’re talking about the assessment that we released in 2024, which uses water quality data from 2020-2022. The silver lining of a multi-year drought is lower nitrate levels in the rivers! We are not talking about whether a single sample of river water exceeds 10 mg/L, we’re talking about whether 10% of the samples exceed 10 mg/L.
Sure, a single sample of finished tap water exceeding the 10 mg/L MCL for nitrate would constitute a Tier I violation of the Safe Drinking Water Act, requiring public notice and corrective action. However, so long as that corrective action is needed less than 36 days each year, we think it’s fair for the burden of removing nitrate from the water to fall entirely on drinking water utilities and their customers rather than polluters.
What, you don’t think this 10% threshold for evaluating the source water makes any sense? Well too bad! We’ve gotten away with doing it this way for decades and calling us on it now would violate the no-take-backsies clause of the Administrative Procedures Act. You’ve made the mistake of focusing on the letter of the law rather than the spirit of the law and we can argue about which pollutants go on which list, which list can be assessed using the 10% binomial statistical exceedance approach, and what hoops you need to jump through to change anything until babies are blue in the face!
Should this arbitrary and capricious abuse of federal authority stand, we might someday have to write a Total Maximum Daily Load (TMDL) explaining why it’s impossible to clean up nitrate in the South Skunk River, Des Moines River, and Iowa River. If you carefully read the TMDLs and permits that we’ve already prepared for the Cedar River and Raccoon River watersheds, you’ll see that would be a waste of our limited staff time and paper.
Nitrate in drinking water is under control. Please stop talking about it. If we must talk about nitrate, we prefer the discussion be framed around Gulf Hypoxia and the Iowa Nutrient Reduction Strategy, because that makes the problem seem far away and less urgent.
In November, the EPA partially approved Iowa’s 2024 Impaired Waters List, adding six additional river segments where drinking water use is impaired by high nitrate levels. I think EPA was right to do this, but I have some concerns. This is the letter I submitted during the public comment period.
Dear Water Division Staff,
I agree with the EPA’s decision to add seven river segments to Iowa’s impaired waters list. I hope that this change will lead to greater transparency about how nitrate pollution of surface waters affects the cost and safety of drinking water, but am concerned there will be unintended consequences.
Iowa’s Credible Data Law has sometimes been a convenient excuse to assess fewer waters, and thereby discover fewer problems. However, that doesn’t seem to be the issue here. Each of the water bodies on this list had at least one “credible” nitrate sample exceeding the 10 mg/L drinking water standard during the three year assessment period.
Raccoon River near Des Moines: 38 of 755 samples collected by Des Moines Water Works exceeded 10 mg/L
Cedar River near Cedar Rapids: 1 of 36 samples collected by the USGS, and 7 of 151 samples collected by Cedar Rapids Water Works
As I understand it, the issue is the threshold for impairment. Since fewer than 10% of the samples (accounting for some statistical correction factor) exceeded 10 mg/L, IDNR says these sites meet the standard. EPA says they do not.
The Iowa DNR’s position is not defensible. In the draft 2024 assessment, Raccoon River near Des Moines was shown as fully supporting its designated use for drinking water because
A) Nitrate in the Raccoon River exceeded 10 mg/L nitrate less than 10% of the time during the 2020-2022 assessment period
B) Nitrate in finished drinking water at the Des Moines Waterworks never exceeded 10 mg/L.
This makes no sense. Even one sample exceeding the Maximum Contaminant Level for nitrate would constitute a violation of the Safe Drinking Water Act, requiring public notice. To avoid this, the Des Moines Waterworks had to run its nitrate removal facility for weeks in 2022 at a cost of $10,000 a day, as well as blending water from other sources and asking residents to reduce water use. Clearly, poor water quality is limiting that beneficial use of the river water!
However, the South Skunk River no longer supplies drinking water to the City of Oskaloosa. The City now gets its water from an alluvial aquifer, and is able to achieve low levels of nitrate in finished water (1.17 mg/L, in the latest Consumer Confidence report) without expensive treatment. I understand that the Clean Water Act does not allow designated uses to be removed if restoring them is still achievable. However, I hope that in prioritizing and writing TMDLs we can be cognizant of facts on the ground. In the unlikely event that a TMDL for the Skunk Skunk River is written and it leads to stricter effluent limits for upstream point sources, we might be imposing real costs on Ames, Story City, and Nevada without achieving real benefits for Oskaloosa.
I am also concerned that disallowing the 10% binomial rule might lead to further politicization of funding for water monitoring. Water quality in rivers is highly variable, and daily or weekly monitoring might pick up on a short-term spike in nitrate that is missed by monthly monitoring. If a single sample can trigger impairment but there are no rules on how often a site has to be monitored, cutting budgets for monitoring programs becomes a tempting way to evade regulation and controversy.
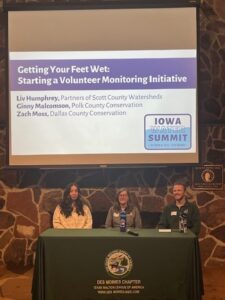
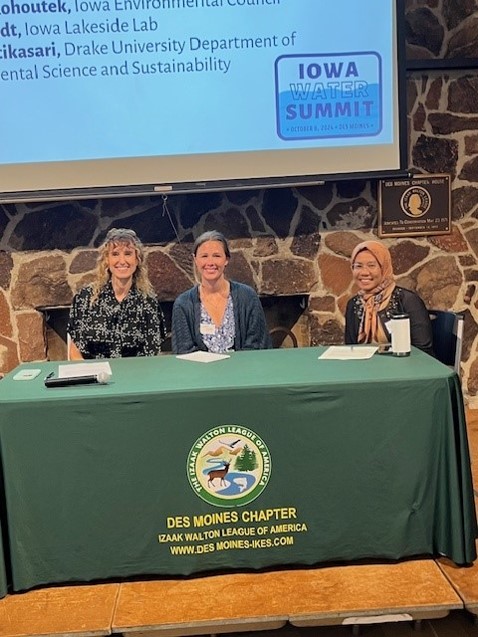
Our grant from the Water Foundation gave me an excuse to dive deep into a big statewide dataset collected by the Iowa DNR. I presented some of that analysis (along with general tips for data analysis) at the Iowa Water Summit in October. Since my slides rarely make sense without the narration, I have also written up a series of set of three case studies about trend monitoring.
I started learning R, a computer programming language for data science and statistics, in 2020. There was a steep learning curve, but now I get to coast downhill. If I can make an interactive map to display which chloride and phosphate readings from a volunteer event fall into the “good” category, I can reuse a lot of that code to make another interactive map that shows which lakes meet the recreation standard for E. coli. If I can figure out how to overlay maps of watersheds and animal feeding operations to calculate livestock density for 60 monitoring sites, it’s not hard to adapt that to calculate a similar metric for wastewater treatment plants. If I can make a good graph for one site, it’s not hard to scale that up to 50 sites.
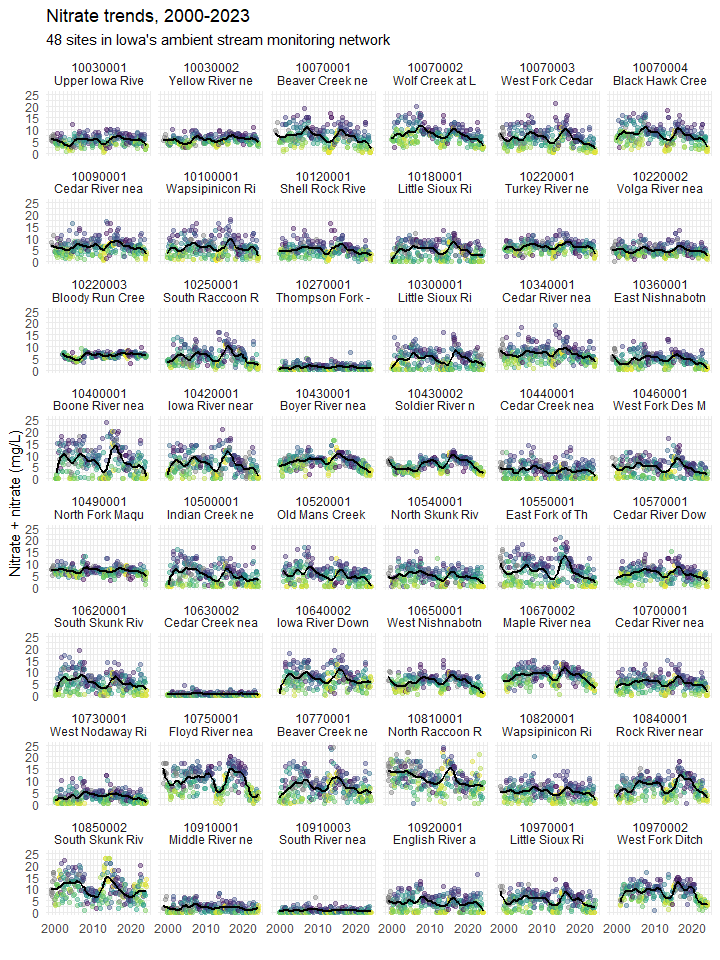
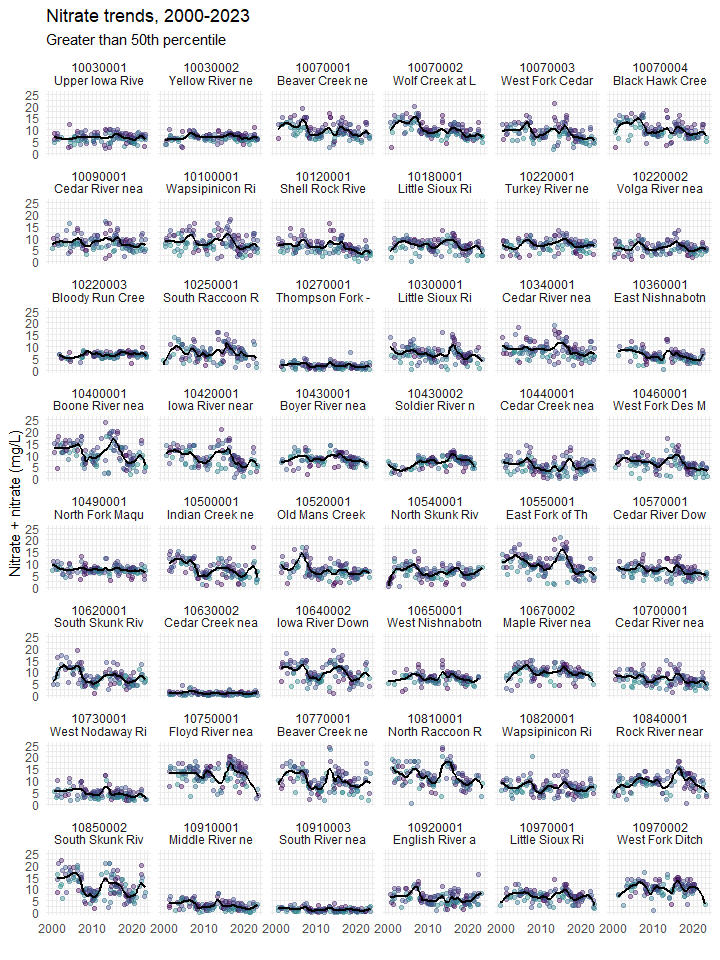
Behold! My finest graph yet! On a single page, you can see 20 years of monthly nitrate data for the 48 sites in Iowa’s Ambient Stream Monitoring network with the longest record. The dots are color-coded to show streamflow at the nearest gage on the day the water samples were collected, yellow when water levels were at their lowest and grading to purple when water levels were at their highest. The black line is a 3-year moving average (or at least a close approximation with LOESS). You’ll notice that nitrate levels in most streams shot up sometime around 2014 and have been declining since. But how much of that is a precipitation-related trend tied to the El Niño-Southern Oscillation and how much is due to conservation efforts in the watershed?
Here comes the magic trick! Watch closely, for when I place into my hat all those samples collected when streamflow was lower than average (yellow and green dots) some of these apparent nitrate trends will…. disappear!
Darn it, that didn’t work at all! For the third of three case studies I’ll link to below, I take a closer look at two of these sites: Black Hawk Creek, where I’d expect a moderate improvement based on cover crop acreage and the East Fork of the Des Moines River, where I’d expect very little improvement. The East Fork actually has a much bigger nitrate trend than Black Hawk Creek and I can’t account for it. Maybe I should give up and leave trend monitoring to the experts at Iowa State University and Iowa DNR, they seem to know what they’re doing (see Danalatos et al. 2022).
However, the trick did work when I compared a watershed impacted by mostly point sources of pollution (i.e. sewage treatment plants) to a watershed impacted by mostly non-point source pollution (i.e. agricultural runoff). This is the first of the three case studies. Phosphorus concentrations have increased in the North Raccoon River and decreased in the South Raccoon has decreased, but that’s entirely due to recent drought. The second case study introduces a new metric for identifying rivers that a strongly influenced by point source pollution, and how to track improvement.
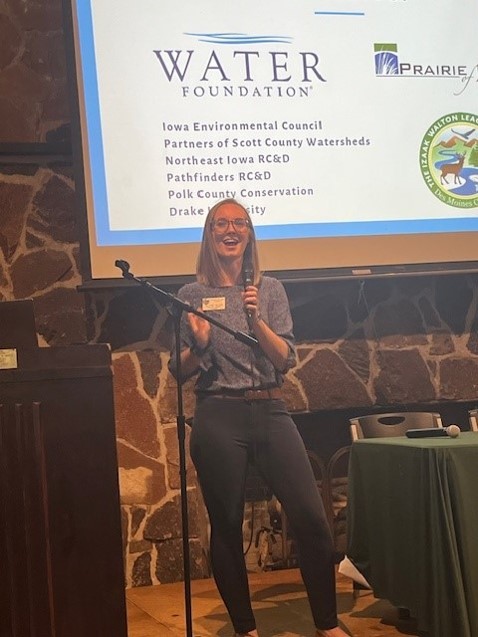
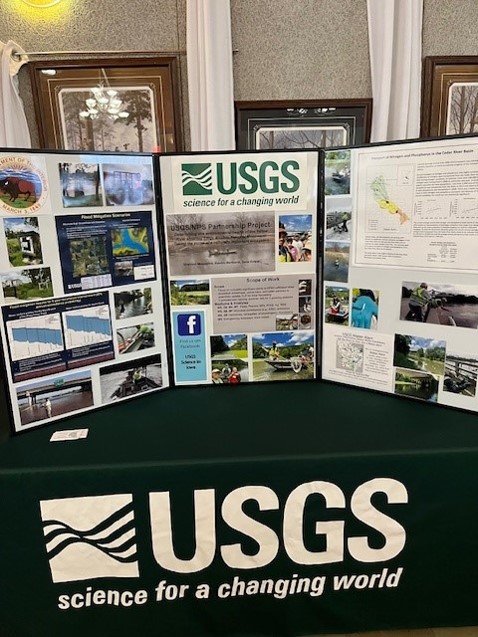
The Iowa Water Summit on October 8 brought together 65 people with an interest in water monitoring for a day of learning and networking. The event was one outcome of the grant from the Water Foundation that Prairie Rivers of Iowa was awarded last year and the regular meetings we’ve been having with seven partner organizations. The Des Moines Chapter of the Izaak Walton League made their facilities available and Heather Wilson (Midwest Save Our Streams Coordinator for the Ikes) did the lion’s share of the planning. Thanks to our presenters, to Bud Hartley for taking these photos, and everyone who helped make the event possible!
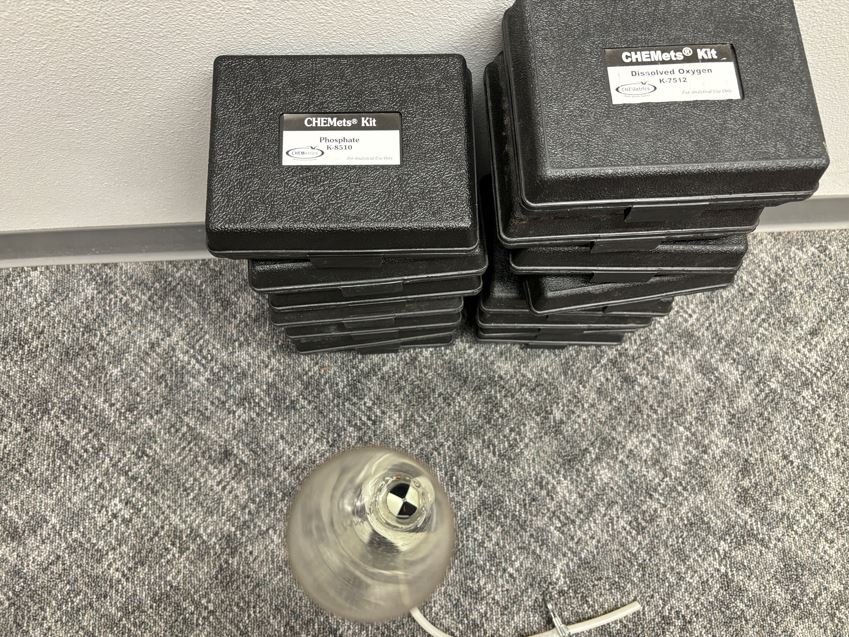
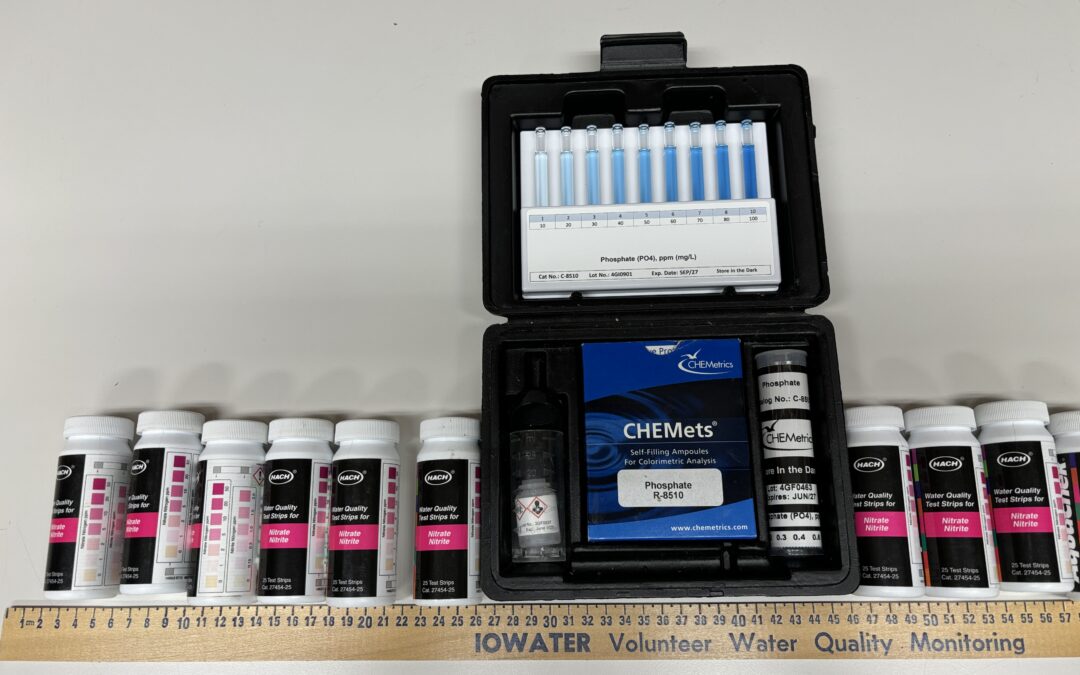
Planning events, dipping test strips, identifying and counting benthic macroinvertebrates, shocking fish, incubating bacterial plates, calibrating equipment, maintaining databases, analyzing data, communicating with the public… There’s a lot of work that goes into finding out what’s in our lakes, rivers, and streams! Between the Water Summit and my 8 years (!) working for Prairie Rivers of Iowa, I’m starting to assemble a picture of the organizations that do water monitoring and where to find the data they collect. Even so, this will not be a complete list! Feel free to add some more in the comments!
State and federal agencies
State and federal environmental agencies do a lot of water monitoring and have a lot of expertise, so if you’re looking for data, your first stop should be one of these databases.
BioNet houses fish and macroinvertebrate surveys collected by the Iowa Department of Natural Resources and the State Hygienic Lab. If you want to know which streams support stoneflies or whether biological diversity has declined in a certain creek, this is the place to find out.
How’s My Waterway is a convenient way to access data submitted to the Environmental Protection Agency from both state and local partners. For example, IDNR uploads their data once a year, while Polk County Conservation uploads their data once a month. EPA’s old system was called STORET, but now it’s the Water Quality Portal for downloads and the Water Quality Exchange for uploads.
The National Water Dashboard provides access to the US Geologic Survey’s network of stream gages, essential information if you live on a floodplain, if you’re planning a canoe trip, or if you need some context to make sense of your water quality data. The USGS also does quite a bit of water quality monitoring, in partnership with the EPA—the National Rivers and Streams Assessment is the best water quality study you’ve never heard of.
Volunteer programs
Iowa has too many waterways for the agencies to monitor on a regular basis, so if you want to know about water quality in your local creek, you may have to do it yourself. Fortunately, since the end of the IOWATER program, other organizations have stepped up to provide volunteers with equipment, training, and a place to store the data.
Polk County Conservation has a very impressive monitoring program, based on the IOWATER protocols, with data housed on the EPA’s Water Quality Portal. Staff, partners and public volunteers monitor 70 sites twice a month. Partners include Des Moines Water Works, the Cities of Altoona, Ankeny, Des Moines, and West Des Moines along with Des Moines Parks and Recreations and West Des Moines Parks and Recreation.
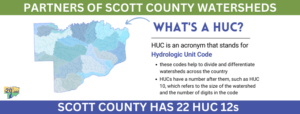
Partners of Scott County Watersheds is one of several organizations with a watershed or regional focus that organize big volunteer monitoring events (snapshots) two or three times a year. They have created their own database and online dashboard to view the results.
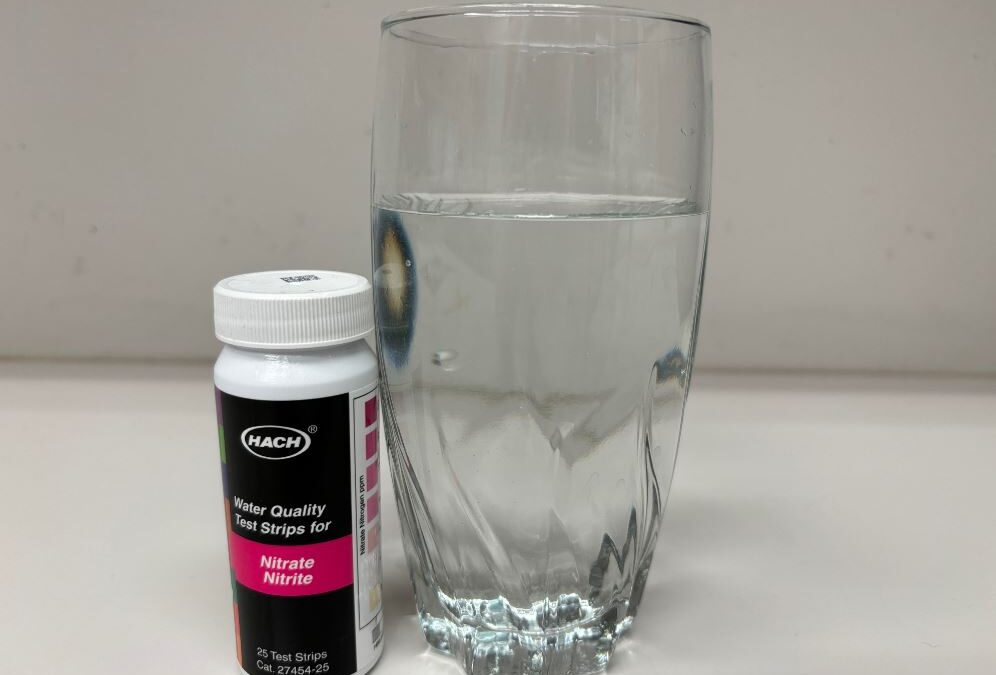
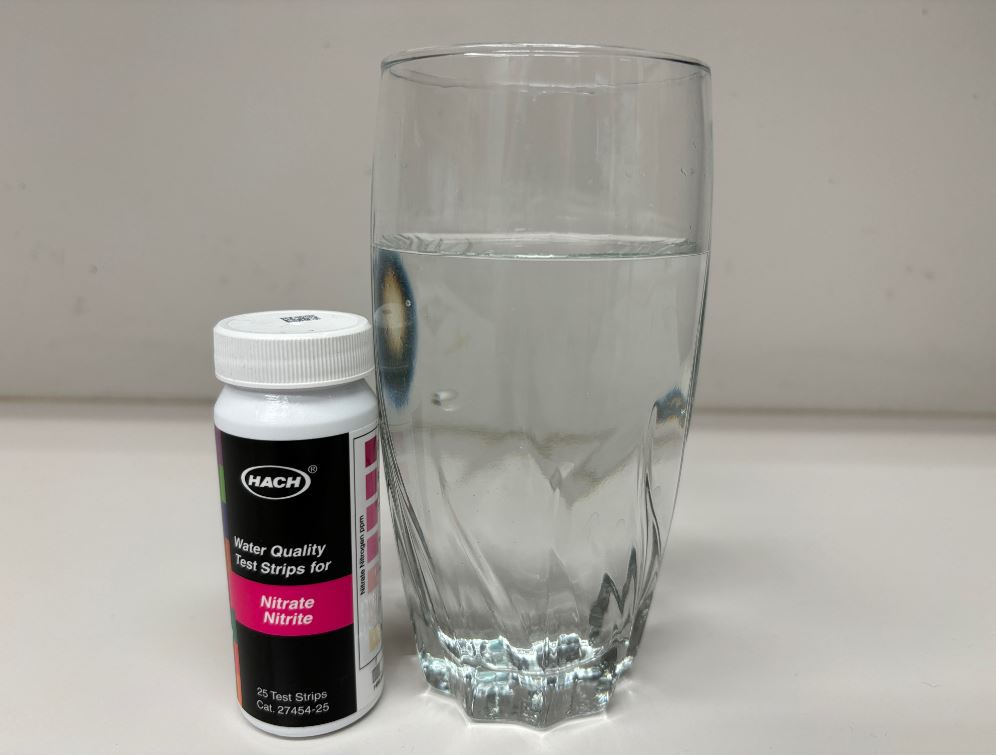
Trout Unlimited has been encouraging anglers in the driftless area to monitor water quality with a test strip and mobile app.
Watershed Projects and Agriculture
Prairie Rivers of Iowa originally got involved in water monitoring to educate the public about the Ioway Creek watershed and track conservation efforts in that watershed. Many watershed projects incorporate water monitoring for one or both of those reasons. A typical approach is to collect water samples once or twice a month during the growing season (plus some samples after heavy rains) and send them to a certified lab for analysis. In our case, that’s a lab operated by the City of Ames water and pollution control department, but others watershed projects have partnered with a university or commercial lab.
Have you seen “Moved by Waters?” The documentary by Fourth Wall Films showcases the conservation, education, and citizen science work that Partners of Scott County Watersheds is doing in the Quad Cities and surrounding farmland. In addition to snapshot events they have a long history of research to try to track down sources of bacteria. Our grant helped them do one more round of microbial source tracking; Vice-Chair Steve Gustafson shared preliminary findings at the Water Summit but it wasn’t straightforward!
The Iowa Soybean Association has supported nutrient sampling of streams and drainage tiles for some 19 watershed projects around the state. The Lower Skunk River WQI project is a good example of that—Pathfinders RC&D collects water samples that are sent to the Iowa Soybean Association for laboratory analysis. Several soil and water conservation districts and agribusiness groups are also partners on the project. Since the ISA collects many field edge samples that come with some privacy concerns, they don’t have a publicly accessible database. However…
Agriculture’s Clean Water Alliance has worked with ISA to monitor nitrate in the Raccoon River, Boone River, and Beaver Creek watersheds. They post annual reports going back decades.
Northeast Iowa RC&D has been coordinating water quality monitoring in the driftless area for 25 years, as described in this article. They have created a nice data dashboard for the Upper Iowa River watershed and the Upper Wapsipinicon River watershed.
Colleges and Universities
The Iowa Water Quality Information System is an amazing map that shows you real-time data from a network of nitrate sensors operated by IIHR (Hydroscience and Engineering at the University of Iowa) and the USGS.
Marty St. Clair (formerly of Coe College, now at University of Iowa) and his students have done sampling and laboratory analysis to support the Middle Cedar River, Indian Creek, Upper Iowa, Turkey River, Maquoketa River, and Upper Wapsipinicon River Watershed Management Authorities.
Drake University’s environmental science department has done stream monitoring to support watershed projects and water recreation in Polk County. It’s often a challenge to maintain access to data that’s collected for student projects, but a solution is in the works.
Iowa State University researchers have done a lot of the field scale and edge-of-field monitoring that established the effectiveness of conservation practices including riparian buffers, saturated buffers, bioreactors, and CREP wetlands. ISU is also responsible for tracking various progress indicators for the Iowa Nutrient Reduction Strategy, including compiling water quality data from IIHR, DNR, and USGS.
Closing Thoughts
Finally, there are organizations that don’t collect data themselves, but help make the other data more accessible to the public. The Iowa Environmental Council sends out a Weekly Water Watch newsletter to provide updates on beach monitoring by Iowa DNR, and they’ve been advocating for standardized, easily accessible, user-friendly data.
That’s an idea I support, and there are people working toward an “Internet of Water.” However, I am a bit skeptical when I hear people say “why don’t you use AI” or “you should really get all this data in one place.” Have you ever tried downloading data from the EPA’s Water Quality Portal that was sourced from more than one organization? I have, and I eventually got something useful out of it, but first I had to delete 20 unused columns and then I had to shorten the column names and then I had to clean up the non-numeric entries that one organization had put in a numeric field, and then I had to filter out the sites where monitoring too sporadic to be representative. Bigger, more flexible systems have their drawbacks.
I am more excited about building relationships and improving communication among the various people who care about water quality and who are involved in monitoring, so we can learn from each other and avoid duplication of effort. Hopefully, the Iowa Water Summit and this article are a step in that direction!


 have taken over this bioretention cell")