by Dan Haug | Apr 6, 2020
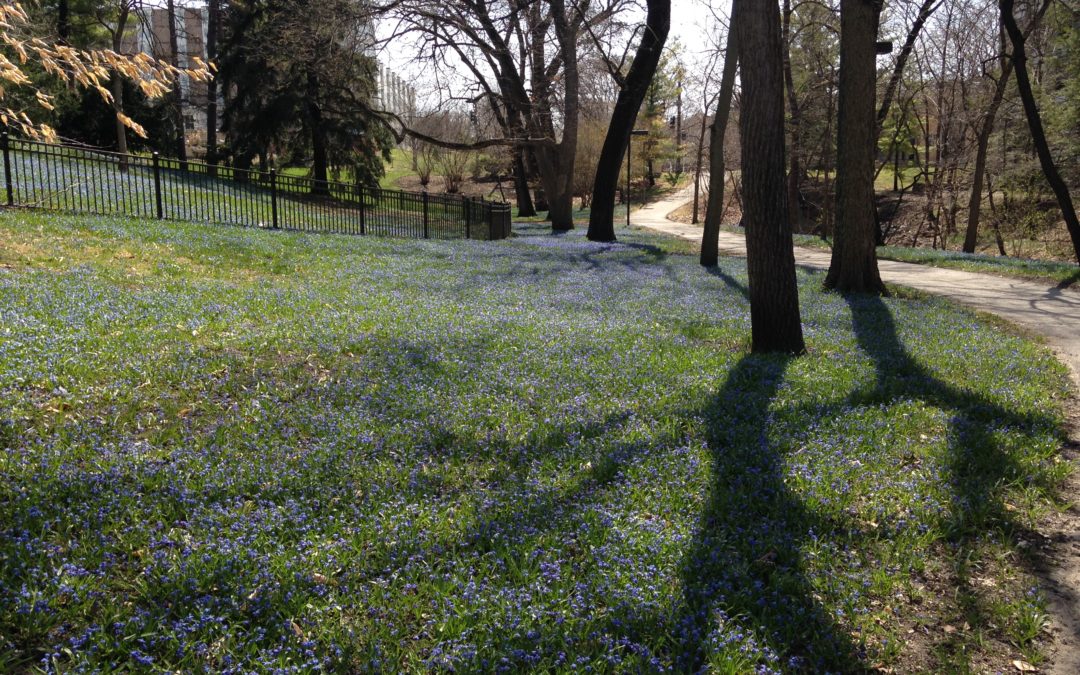
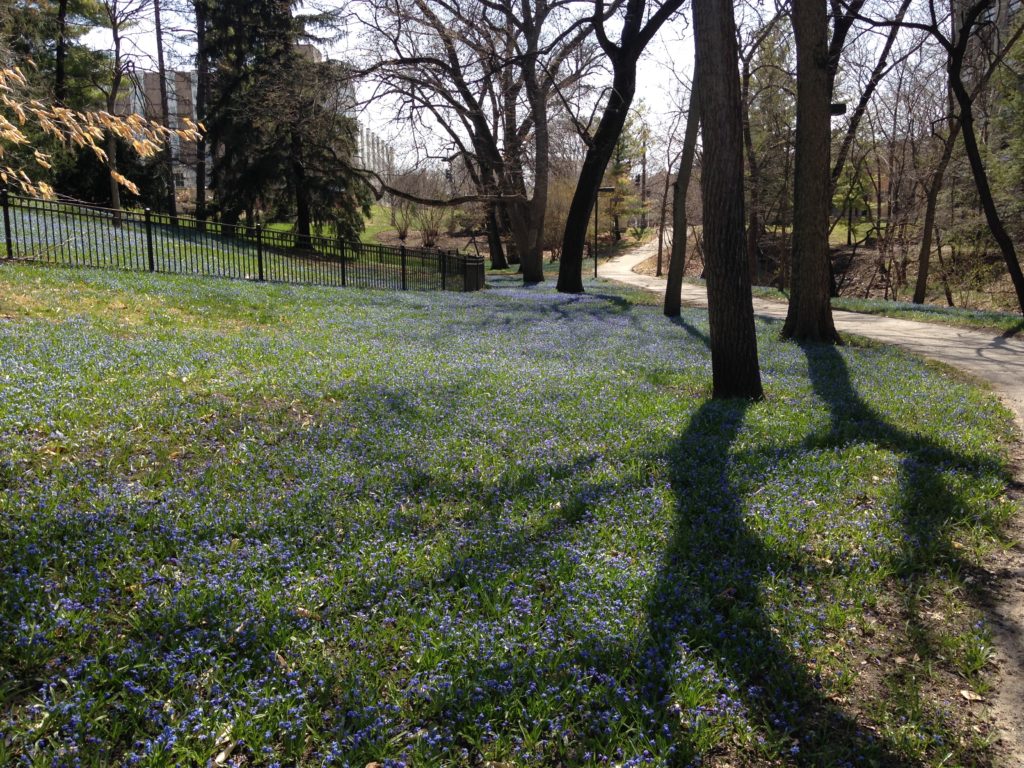
We’re all a bit stir-crazy and can benefit from spring weather and spring flowers. If you’re in Ames, I recommend walking east of the ISU campus, where (as of April 5) the ground is carpeted with blue flowered squills, Scilla siberica. It’s not often that you see that color blue in nature, or in that quantity!
While you’re there, take a peek in College Creek. When I visited, the water was clear, the bottom was rocky, and it was full of 4-6 inch fish.
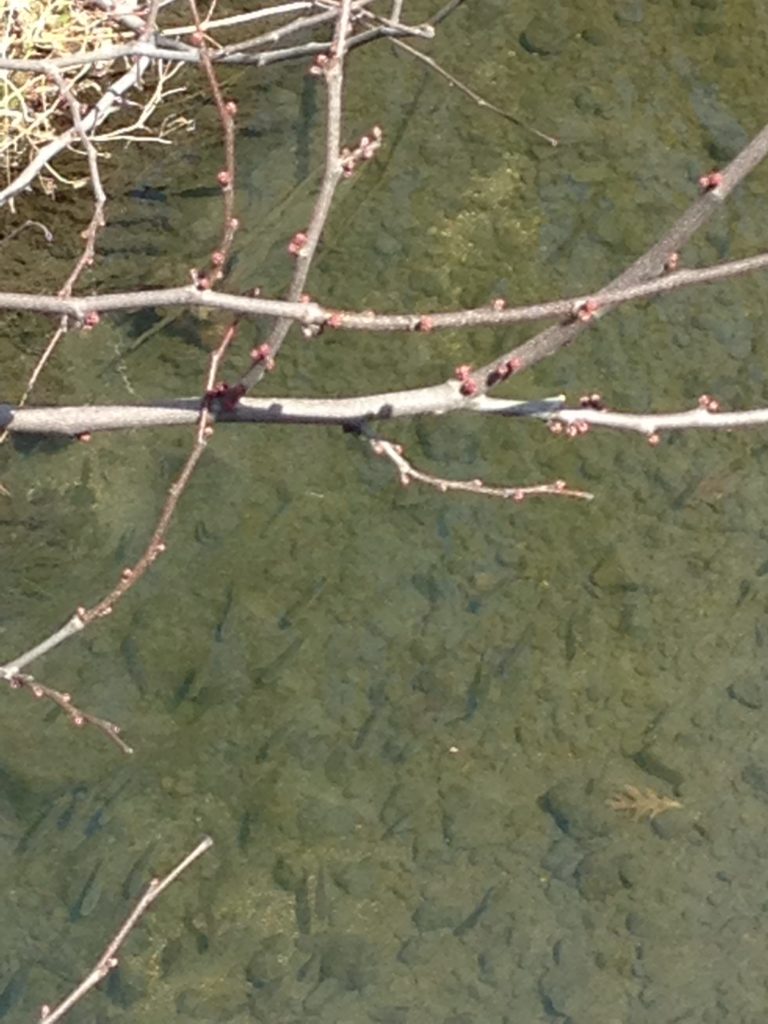
This was great to see. College Creek used to be a dump, but between legal action against businesses and mobile home parks that were discharging sewage, urban conservation projects, and the annual trash clean-up event, it’s become a lovely place. Most of our backyard streams have the same potential, if we treat them right.
I should caution you that that E. coli levels in College Creek and other streams in Ames often exceed the primary contact recreation standard, but you’re washing your hands constantly anyway, right? (Bold values in the table below exceed the single-sample maximum of 235 colonies/100mL. Data are collected and posted by the City of Ames.)
| SAMPLE DATE | SKUNK RIVER | SQUAW CREEK | CLEAR CREEK | COLLEGE CREEK | WORLE CREEK |
|---|
| October 11, 2019 | 558 | 758 | 268 | 1,024 | 378 |
| September 24, 2019 | 1,764 | 1,446 | 320 | 904 | 1,024 |
| August 6, 2019 | 122 | 2,909 | 6,867 | 8,664 | 3,448 |
| July 16, 2019 | 839 | 5,172 | 24,196 | >24,196 | 2,098 |
| June 11, 2019 | 173 | 374 | 414 | 583 | 594 |
| May 16, 2019 | 63 | 231 | 189 | 265 | 384 |
| April 9, 2019 | 122 | 158 | 85 | 2909 | 448 |
| October 16, 2018 | 187 | 187 | 171 | 298 | 282 |
| September 18, 2018 | 479 | 105 | 50 | 261 | — |
| August 14, 2018 | 275 | 529 | 1439 | 2098 | — |
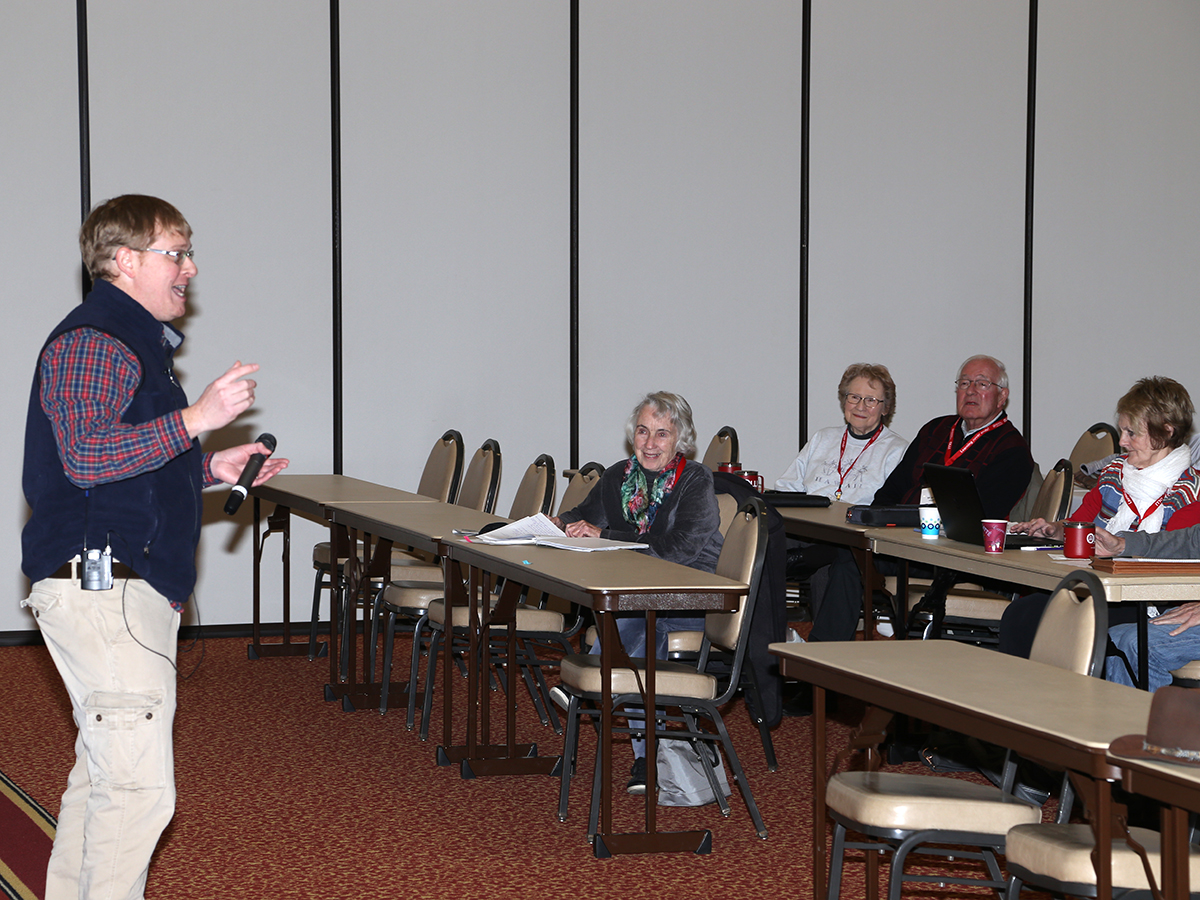
by Dan Haug | Feb 12, 2020
Prairie Rivers of Iowa kicked off 2020 with watershed education for both the young and old. Over four sessions in January and February, watershed educator Dan Haug spoke with 20 retirees for an Osher Institute for Lifelong Learning (OLLI) class at the Iowa State University Alumni Center. In addition to unpacking difficult topics like the Clean Water Act and water monitoring, Dan introduced the class to online resources he uses to find out about water quality in local rivers and lakes, and about landuse and soils in their watersheds. The class brought back examples and asked questions about rivers, lakes, and drinking water in their home towns and vacation spots, giving us all a better picture of water quality issues and solutions around the state.

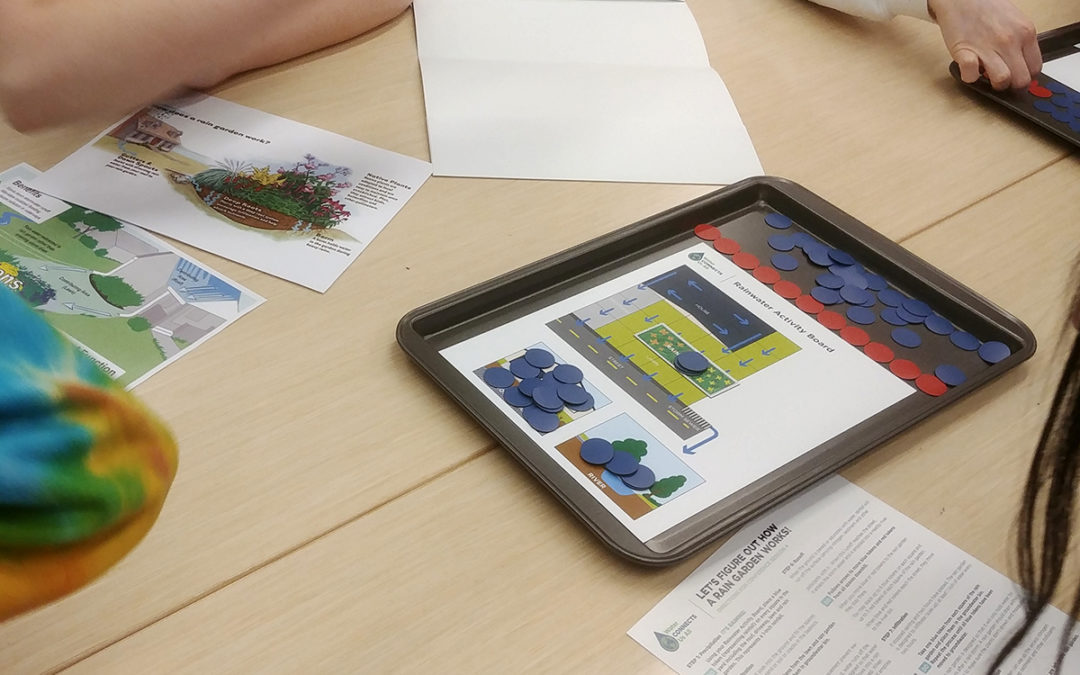
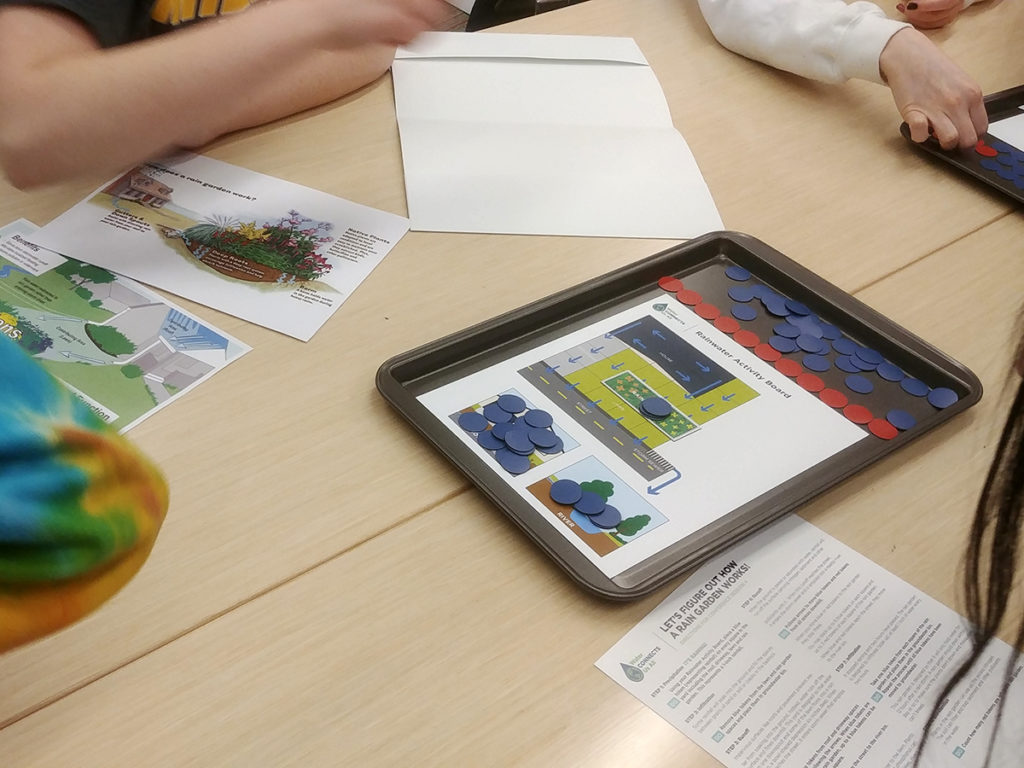
On February 7-9, high school students from Iowa, Minnesota, Illinois, Missouri, Minnesota, and Oklahoma attended a training on the ISU campus for the
4-H Ag Innovators Experience, sponsored by Bayer and the national 4-H council. By training teenage facilitators to lead activities at their 4-H clubs, schools, or community events, the program has helped over 5000 youth learn about monarch butterflies and native bees in previous years. This year, the focus is on ecosystem services, water quality, nitrogen, and engineered conservation practices. The youth will be learning about bioreactors, saturated buffers, bioswales, and rain gardens. Watershed Educator Dan Haug helped the planning team at ISU Extension create a hands-on activity to show how rain gardens can soak up runoff, as well as creating maps that the youth will use for a simulated watershed planning exercise. At the training, Dan shared his experience working with real-life watershed management authorities and worked with the teen leaders in the computer lab to track down information on their own watersheds. This is a far-reaching project with input from a great group of educators and water experts. We were happy to be a part of it!
Contact us if you have an idea that could become our next educational event or project!
by Dan Haug | Jan 8, 2020
Thank you to the board members who brought in donuts and coworkers who brought home-baked desserts to the office in 2019. As a result, my New Year’s resolution is to lose weight and eat healthier!
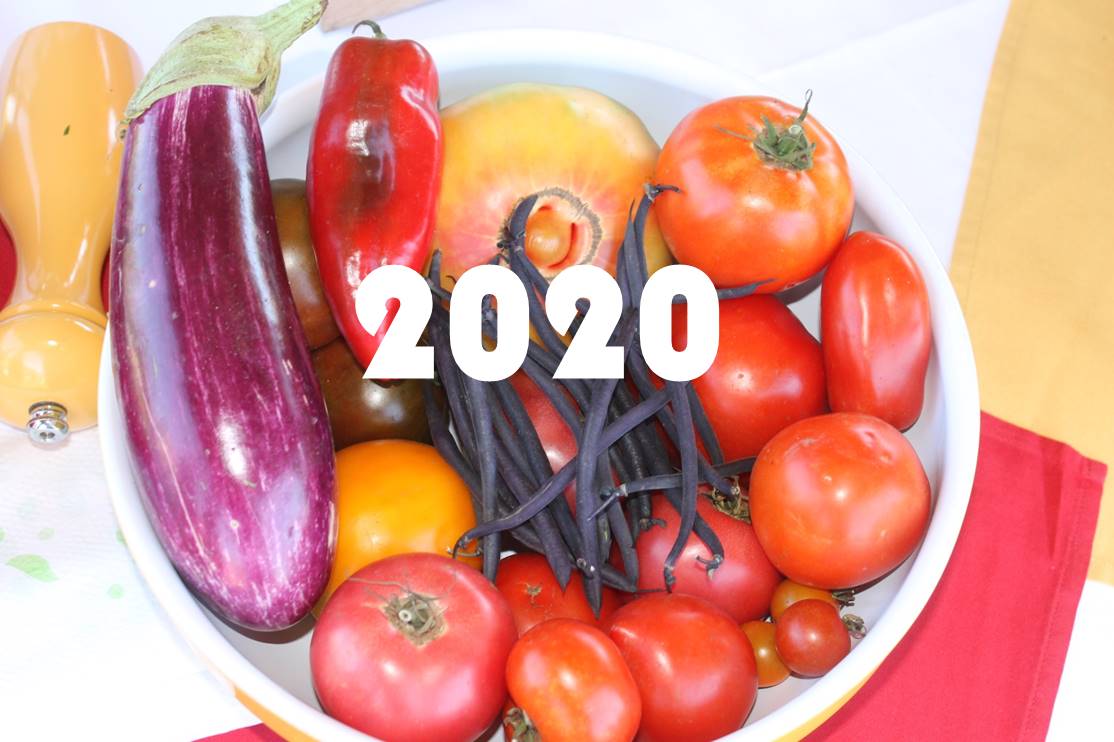
Kidding aside, Prairie Rivers of Iowa is an organization with a long track record of supporting local food systems. Local food is a much better framework for healthy eating than picking processed foods based on high-this or low-that claims on the box. Whole foods—vegetables from the farmers market or CSA, eggs from my backyard chickens, fruit from U-pick orchards—are not just nutritious but a source of joy in the harvesting, purchasing, and cooking. “Eat more locally grown fruits and vegetables in 2020” is a pledge that makes me look forward to the coming year rather than dreading it.

But I’m not overweight and in pain because I don’t eat fruits and veg. Like most members of my extended family, I have chronic health conditions that are exacerbated by sugar, saturated fat, and refined carbohydrates. Like most Americans, I eat a diet high in those things because of they are socially encouraged (how many times have you accepted cookies to be polite) or cheap, convenient, and well-advertised. With half a pig in the freezer (raised by Tom and Carman Rosburg), I asked my doctor for dietary recommendations that did not involve giving up ham and got a very sensible response—cut back the red meat to one or two meals a week. A similar strategy can apply to sweets, white rice, potatoes, and baked goods made without whole-grain flours.
I’ve had one week of planning for moderation and succeeding, after a previous week of planning for abstinence and failing. I can already see how that shift in perspective could be more sustainable—both in the sense of “being able to keep it up past February” and in the sense of “preserving soil, water, and biodiversity.”
When I budget my pastry intake for the week, it becomes imperative to choose something I really like, rather than something convenient like store-bought donuts, muffins, or cookies. That has benefits for the environment, as these foods are often made with palm oil, usually produced by cutting down rain forests.
If full fat cheese and red meat are viewed as an indulgence rather than a staple, I can afford to buy premium products directly from local farmers that are employing the most sustainable practices –for example, Lost Lake Farm near Jewell makes delicious hard cheeses with a rotational grazing system that builds soil organic matter.
Currently, 36% of the US corn crop goes to feed livestock, which converts about 20% of that energy into food calories. 40% of the corn crop goes to ethanol and much of the rest goes into processed foods and sweeteners. This is not an efficient way to feed the world. Prairie Rivers of Iowa has worked with corn, soybean, and livestock producers of all sizes who are making changes to protect soil and water, but widespread adoption of cover crops, perennials and extended rotations has been limited by a lack of local markets and processing for additional crops. If consumers ate less meat and processed foods and more whole grains, and Midwestern farmers shifted some acres out of corn*, it would have undeniable benefits for public health, climate, soil, and water.
*We could shift away from sugar beets, which produce even less nutrition per acre than corn and have their own environmental impacts. You’re not getting off so easy, North Dakota and Minnesota!
by Dan Haug | Nov 20, 2019
The Iowa Department of Natural Resources is seeking public comment on the newly released draft impaired waters list. Prairie Rivers of Iowa will be recommending that Squaw Creek and East Indian Creek be added to “Waters in Need of Further Investigation.” We’ll also take this opportunity to try to demystify a topic that can be confusing, using examples from the South Skunk River watershed.
Every two years, the DNR is required to assess the available data to determine whether Iowa’s lakes, rivers, and wetlands are meeting their designated uses. About half the rivers, and a bit more of the lakes have enough data to assess. Since new waters are considered each cycle, the length of the impaired waters list doesn’t really tell us whether water quality is getting worse. Since nutrients aren’t considered for most uses and the data used for the 2018 assessment is from 2014-2016, it doesn’t tell us whether the Iowa Nutrient Reduction Strategy is working. What it tells us is the extent and severity of local water quality problems that have been officially vetted.

Recreational Uses
A river segment, lake, or reservoir that gets use by paddlers or where children play would be designated A1 (primary contact recreation use) or A3 (children’s recreational use). To determine whether the water quality is good enough to support these uses, the DNR compares E. coli bacteria to the state standard (a geometric mean of 126 organisms per 100mL). If the stream consistently exceeds the standard, that means there could be enough human or animal waste in the water to pose a health risk to anyone that swallowed some–a child splashing in the creek, or a paddler who tipped their canoe might get exposed to a waterborne illness.
Fully supporting: None of the lakes or rivers in our watershed appeared on this list
Partially supporting: The South Skunk River above Ames was slightly impaired with high E. coli levels in one of three years. Indian Creek near Maxwell, the upper part of Long Dick Creek in Hamilton County, Montgomery Creek in Boone County, Hickory Grove Lake in Story County, Lake Keomah and White Oak Lake in Mahaska County all have moderate E. coli problems.
Not supporting: Prairie Creek in Boone County has consistently high E. coli levels. The data was collected through an agreement between Iowa DNR and volunteers with the Squaw Creek Watershed Coalition.

Not assessed: This includes Squaw Creek, East Indian Creek, McFarland Pond, and many others.
Wait a minute, Squaw Creek and East Indian Creek? Didn’t we work with City of Ames and Story County Conservation to collect three years of monthly E. coli samples, starting during the assessment period? Wasn’t the 2016 geometric mean ten times higher than the standard? Yes, but DNR never approved a quality assurance plan, so under Iowa’s Credible Data Law, they can’t use our data. However, we will write to DNR to recommend that they add those streams to Iowa’s list of waters in need of further investigation (WINOFI). We’re aware that bacteria cleanup plans for large rivers are difficult to do and are a low priority for the department, but we want people to be more aware of the health risks.
Aquatic Life Uses
The South Skunk River is a warm water stream with a smallmouth bass fishery, so is designated B(WW-1). Most of its perennial tributaries don’t have enough water or habitat for gamefish so are designated* B(WW-2) for other aquatic life. Fish kill reports, biological monitoring of fish and invertebrates, and monitoring of dissolved oxygen and some toxic chemicals are used to assess whether water quality is good enough to support these uses.
*Adding to the confusion, smaller creeks are given a presumptive A1 B(WW-1) designation until a Use Attainability Assessment proves otherwise. This change supposedly gives them extra protection, but I don’t see how that would work in practice.
Fully supporting: A lower segment of the South Skunk River in Mahaska County, Little Wall Lake, Hickory Grove Lake, lower Squaw Creek, and Montgomery Creek appear to have good enough water quality for a healthy aquatic community. FYI: Fish aren’t bothered by high nitrate or E. coli.
Partially supporting: The South Skunk River above Ames, the upper part of Squaw Creek, Long Dick Creek, upper Ballard Creek, and Walnut Creek are on the impaired waters list due to fish kills or a low quality fish or invertebrate community.
Waters in Need of Further Investigation: Onion Creek, Worrell Creek, and College Creek had some low scores for fish or invertebrates, but DNR hasn’t worked out an appropriate threshold for these headwater creeks. The lower part of Ballard Creek was removed from the impaired waters list and placed in this category when DNR discovered an error in the previous assessment.
Not Assessed: This includes several segments of the South Skunk River, Dye Creek, Clear Creek, Keigley Branch, West Indian Creek and many others.

Takeway message:
If a river was added to the impaired waters list, don’t assume it’s gotten dirtier. Maybe it was always polluted and we hadn’t bothered to look. And by the same token, if a river is not on the impaired waters list, don’t assume it’s clean.
by Dan Haug | Oct 9, 2019
Nitrogen rate management (MRTN) is the low-hanging fruit of the Iowa Nutrient Reduction Strategy, a win-win for profitability and the environment. On closer inspection, that fruit is even juicier than we thought; but harder to reach.
Here’s the paradox of nutrient management that the general public fails to grasp. We don’t know with any certainty at application time how much nitrogen the corn crop will need or how much nitrogen will be left in the soil come July when the crop starts maturing. Corn stalk nitrogen tests and split applications can improve the accuracy of the guess, but farmers still have to guess. If they guess too low, they lose income. So most farmers err on the high side, which means that (all else being equal) more nitrogen will end up in our streams.

Figure by John Sawyer at ISU. The economically optimum nitrogen rate varies by year, even on the same field.
We may not know what’s the right amount of nitrogen to apply this year, but we can pinpoint a range that makes the most economic sense across sites and years. In 2005, Iowa State University researchers crunched the numbers and developed an online calculator. A farmer can enter current prices for corn and fertilizer to get the Maximum Return To Nitrogen (MRTN). Above that range, they might get a bit higher yield, but the revenue from those extra bushels doesn’t offset the cost of the extra nitrogen. Applying nitrogen at the MRTN is a rare win-win for profitability and the environment.
Along with cover crops, wetlands, and bioreactors, MRTN was one of the more promising practices for nitrogen outlined in the Iowa Nutrient Reduction Strategy. Still, the authors cautioned that it wouldn’t get us very far by itself. An average field would cut nitrate losses by 10 percent. Since some parts of the state apply less nitrogen than others, universal adoption of this practice would get us a 9 percent reduction in nitrate concentrations.

That modest reduction assumes Iowa farmers currently apply 150 lbs of N/acre on a corn-bean rotation and 190 lbs/acre on continuous corn, a figure the authors admitted were “possibly outdated.” A 2017 survey by ag retailers found that Iowa farmers apply 169 lbs/acre of nitrogen on corn after beans and apply 210 lbs N/acre on continuous corn. I updated Dr. Helmers graph with those numbers and an MRTN based on current corn and nitrogen prices to determine the potential water quality benefit. This low-hanging fruit is juicier than we thought!

And that’s just the average! Inspired by a recent essay by Chris Jones, I read a manure management plan for a field in one of our watersheds. It receives 190 lbs/acre of nitrogen and 146 lbs/acre of phosphorus in the form of liquid swine manure. If that manure could be spread over more acres at a rate of 140 lbs/acre, that could reduce nitrate losses by 31%. If it replaces rather than supplements commercial fertilizer, we could get another 4% cut in nitrate. Manure is a slow-release fertilizer and less susceptible to leaching.

Is that economical? Hard to say. Daniel Anderson reports that liquid swine manure can be moved seven miles and still be cheaper than synthetic fertilizer. In Story and Boone County that might work. Hamilton County has 218 manure management plans, so I’m not sure how far you’d need to travel to find a field not already being treated. Are there changes in processing or additional cost share that would help make it more feasible? I don’t know. No-one is talking about it. But cover crops work equally well. Winter rye grows thicker with fall-applied manure and can scavenge nitrogen that would otherwise be lost.
Unfortunately, neither of those options (MRTN or cover crops) are even suggested as part of manure management plans and the loudest voices in the room are saying livestock producers don’t need to be doing anything differently. Until that situation changes, the widespread adoption of rate management that’s assumed in statewide and watershed-based scenarios won’t happen and we will fail to meet our nutrient reduction goals.