You may have seen a “Swimming Not Recommended” sign at an Iowa lake this summer. In order to prevent those signs from going up, the first step is often to find the watershed or “beach shed.” That may sound like the place you go to change into your swimming suit or store your boat, but in this case we mean the land area that drains to and influences a given body of water.
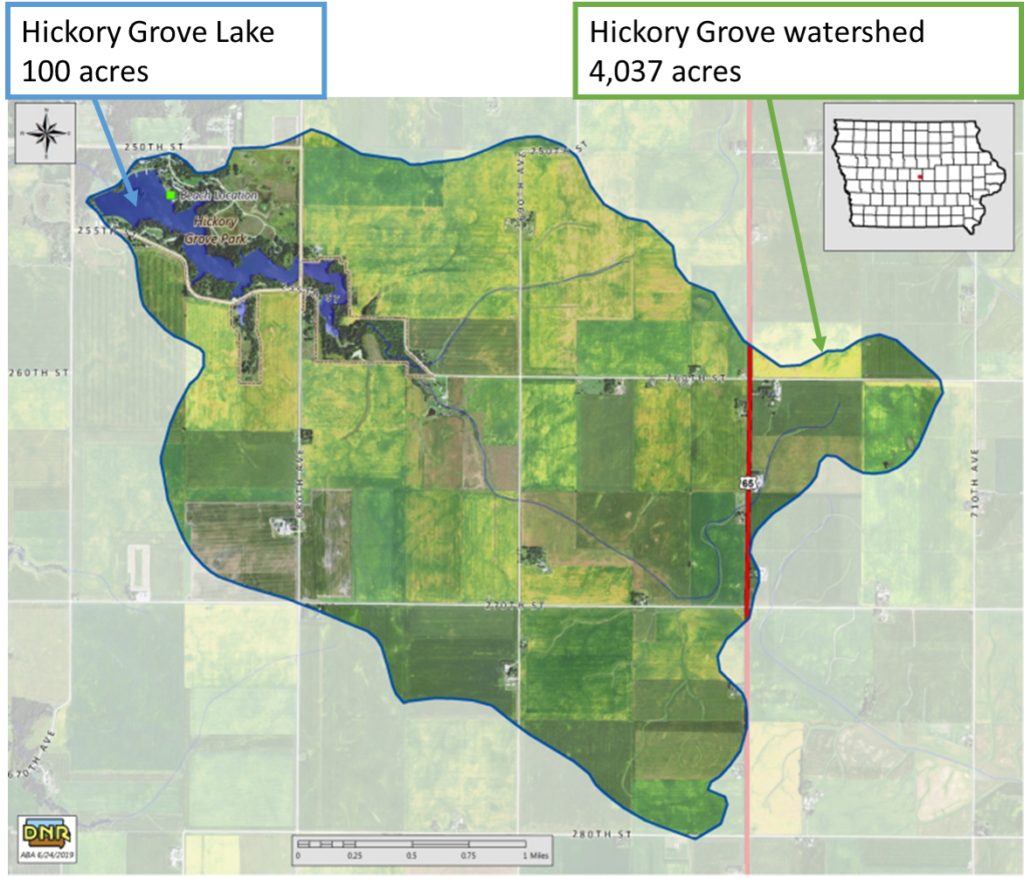
For example, while Hickory Grove Lake in Story County is only 100 acres, the phosphorus that stimulates algae blooms could be washing into the lake from over 4000 acres in its watershed. Farmers and homeowners in the watershed have been working since 2008 to install conservation practices and fix up septic systems, with the help of Story Soil and Water Conservation District and other partners. When the rains come and water refills the restored lake, these efforts will ensure that the lake doesn’t refill with algae.
Water quality solutions can get a little smaller and more manageable if we can focus in on a problem area with a smaller watershed. As part of a water quality improvement plan (TMDL) for beaches, the Iowa DNR has done detailed studies of Hickory Grove Lake and five other lakes. They found that in all cases, fecal bacteria (the other cause of beach closures) were higher in the wet sand than in the water, higher at the shoreline than the deeper parts of the swimming area, and lowest outside the swimming area. It means that we can focus on just the 2.8 acres that drain directly to the beach at Hickory Grove (the “beach shed”, as the DNR put it) rather than in the entire lake and its watershed. Solutions for this beach and the other five include regular grooming of the sand, making the shoreline less attractive for geese, and redirecting or treating polluted runoff from parking lots and picnic areas.
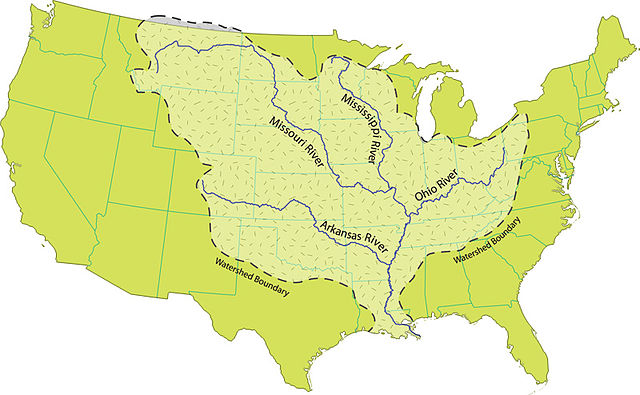
But if the water quality problems are big enough (like the dead zone in the Gulf of Mexico) then our solutions need to get bigger. All Iowa is part of the 1,151,000 square mile Mississippi River watershed, so all Iowans can do their part to keep nitrogen and phosphorus from washing downstream.
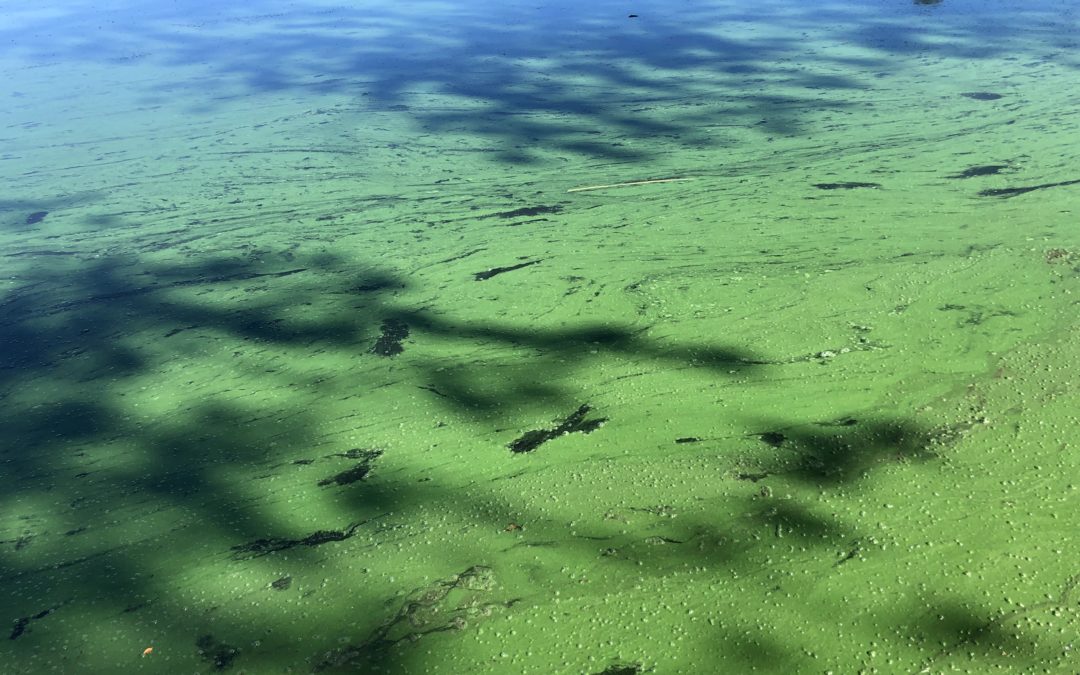
I got a good look at a cyanobacteria “bloom” over Labor Day weekend, at a lake in Wisconsin. Cyanobacteria can produce toxins, and this proliferation of green gunk had done so earlier in the month, causing a large number of fish to go belly up. Cyanobacteria toxins can also be dangerous for people and dogs.
There were warning signs posted but they were wordy and left some doubt about whether it was okay to go in the water. Some kayakers were ignoring them. This has been an issue in Iowa as well. The Iowa Environmental Council is working with Iowa DNR to make the warning signs simpler and more visible. The Environmental Working Group recommends that midwestern states do more frequent testing for microcystins, the most worrisome class of cyanobacteria toxins. I support these steps, but I also think it’s important to let the public know what to look for, as its not always possible to run tests and post warnings in a timely manner. How about this rule of thumb, illustrated in the graphic above? If it looks like paint, stay out!
Not every cyanobacteria bloom can be so easily identified, and not all cyanobacteria produce toxins, but enough of the toxin-producing species do look like spilled paint or “pea soup,” that it seems like a good starting point.
When I first arrived at the lake, it was streaks of green and brown in the water, like the rinse station for a child’s art project. The next day, more had been blown to our side of the lake and it formed a thick surface scum with bubbles, like latex paint left out for too long, and had a nasty smell. The color was a bright green mixed with brown but cyanobacteria blooms can also be bluish green, blue, brown, or red.
Some of the harmless green things more commonly growing in lakes, streams, and ponds look completely different, as pictured above.
Duckweed looks like confetti scattered on the water surface. There’s a few different species ranging from dots (the 1 cm Spirodela) to specks (the 2 mm Wolffia). They are large enough you see the individual round leaves with the naked eye, and they sometimes have trailing roots. Surprisingly, it’s actually a flowering plant related to peace lillies, with tiny, wind-pollinated flowers. As the name implies, they are an important food source for waterfowl.
Green algae are a huge assortment of plant relatives, some single-celled and microscopic (until there are enough to turn the water green), some joining together into spheres, nets, or filaments. Filamentous green algae look like slimy hair when they grow on rocks, and like drain clogs when they are dislodged and float on the surface or wash up on beaches.
And then there’s a variety of aquatic plants (pondweeds, coontail, and others) that can be found rooted to the bottom. While dense “weeds” can be a nuisance for motor-boaters, a plant-dominated lake is better for fish than an algae-dominated lake, or one with nowhere to hide and nothing to eat.
If the lake looks like paint, stay out! Experts, can I say that? It’s an over-simplification, but not everyone has the patience to read a more complicated message, or the good sense to take it seriously.
For more on harmful algae blooms and how to keep yourself and and your dog safe, the Iowa Public Health Department has some good resources.
Water quality in the South Skunk River is still poor but has gotten better in the last five years. One reason for improvement is a new disinfection system at the Ames wastewater treatment plant.
Dr. Chris Jones recently shared a water quality index he developed for Iowa rivers, combining five important water quality metrics. Of the 45 sites in the Iowa DNR’s ambient monitoring network, the South Skunk River near Cambridge scored “poor” and ranked 34th overall. This site also has the 3rd highest phosphorus and the 5th highest E. coli levels.
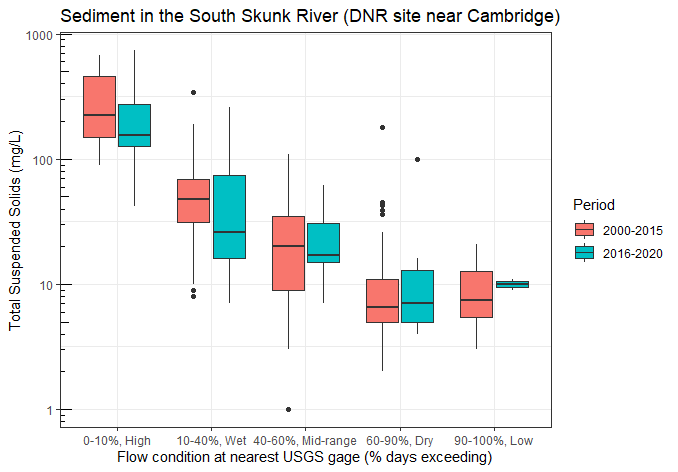
A follow-up article looked whether the current (2016-2020) water quality index has changed from previous decades. Most rivers have stayed the same or gotten worse, but the South Skunk had a better score. Three of the metrics (total phosphorus, total nitrogen, and E. coli bacteria) improved, while one (turbidity, a measure of sediment in the water) got worse.
Phosphorus and muddy water usually go together, so this odd pattern demanded some explanation. I did my own analysis of the data, curious if the changes were happening under drier conditions (when wastewater has a bigger influence), wetter conditions (when agricultural runoff has a bigger influence) or both.
See last week’s post for an explanation of the flow categories I’m using. I use a lot of boxplots, which show both the central tendency and the spread of the data. The lower end, middle, and upper ends of the box are the 25th, 50th (median) and 75th percentiles. The “whiskers” show the maximum and minimum, unless they’re really far out there, in which case the “outliers” represented by dots. Water quality data never fits a bell curve, so lopsided boxes and outliers are to be expected.
It turns out that the river didn’t get any muddier (it got less muddy) when you compare wet conditions to wet conditions and mid-range conditions to mid-range conditions.
It’s just that the past five years were a little wetter and so a larger share (43% vs 29%) of the samples were collected during wet conditions when the river was moving swiftly and carrying more sediment. A smaller share (25% vs 42%) of the samples were collected during dry and low-flow conditions when the water is usually clear. That made the average sediment concentration increase.
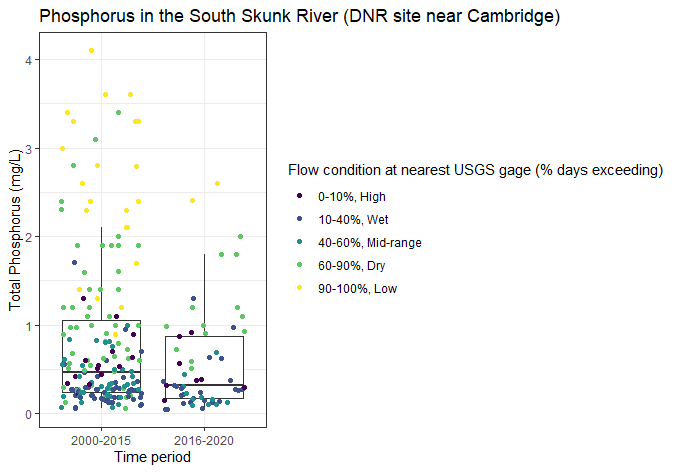
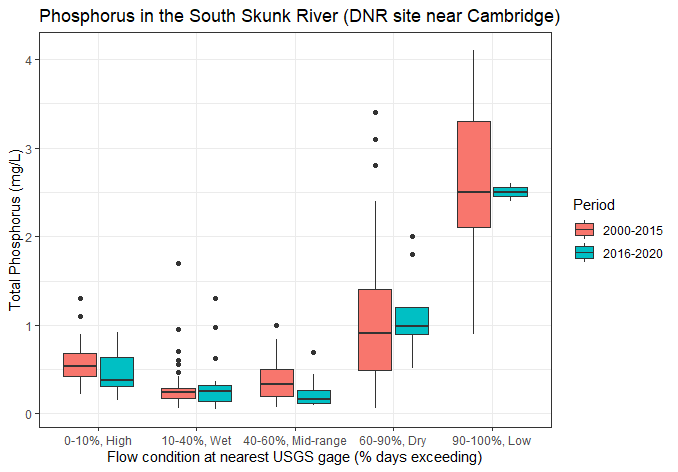
Weather also can explain trends in phosphorus. In the past five years, a smaller share of the samples were collected during dry and low-flow conditions when phosphorus concentrations are especially high. That made the average phosphorus concentration decrease.
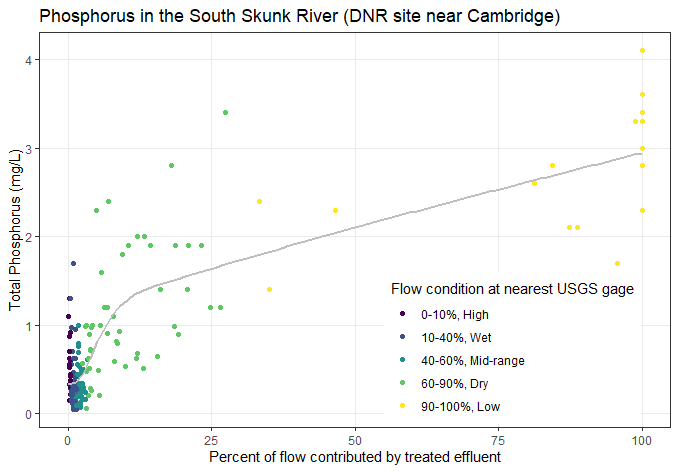
Why is phosphorus so high when it’s dry? The monitoring site in question is just below the outfall of Ames Water Pollution Control Facility on 280th St, about 4 miles north of Cambridge. This facility discharges over 6 million gallons a day of treated wastewater. When conditions are dry, the effluent is less diluted, and so phosphorus in the stream approaches phosphorus levels in the effluent (which averages 3.8 mg/L), as shown in the graph below. This year we’ve also monitored West Indian Creek below the Nevada wastewater treatment plant and have seen the same pattern.
Wastewater treatment plants are regulated to minimize the impact on receiving waters and the Ames WPC Facility has one of the best compliance records in the nation. However, while the treatment process is very good at removing ammonia, solids, and oxygen-depleting substances, the process is not that effective for removing nutrients.
The Iowa Nutrient Reduction Strategy is not voluntary for wastewater treatment plants. The Ames Water and Pollution Control Department commissioned a feasibility study as a condition of its permit, which determined that the facility could achieve a 67% reduction in total nitrogen and a 75% reduction in total phosphorus by replacing its trickling filters with an activated sludge treatment system. This new system will be phased in as the filters reach the end of their useful life (starting in 2027) and will cost $39.6 million.
In the last five years we have not seen any reduction in phosphorus during dry and low-flow conditions when wastewater treatment systems have the biggest influence. However, there was a reduction in phosphorus* under mid-range and high flow conditions! This is really interesting–I’ll have to look at some other data sets to see whether it holds up and whether we can link it to conservation practices in the watershed.
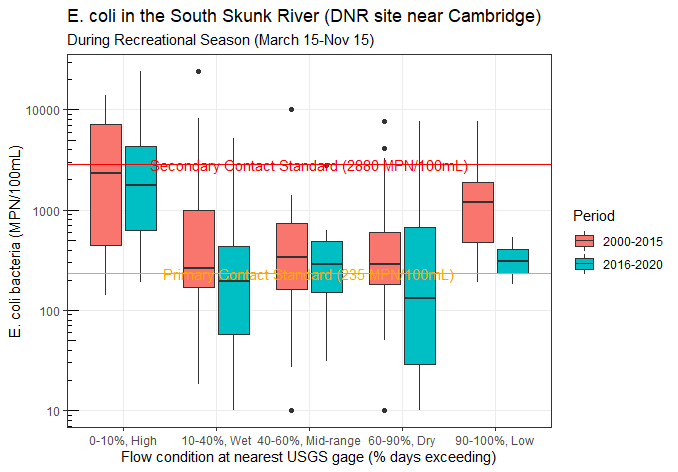
For E. coli, we see improvement across all conditions, with the largest improvement during low-flow conditions* when wastewater has the biggest influence.
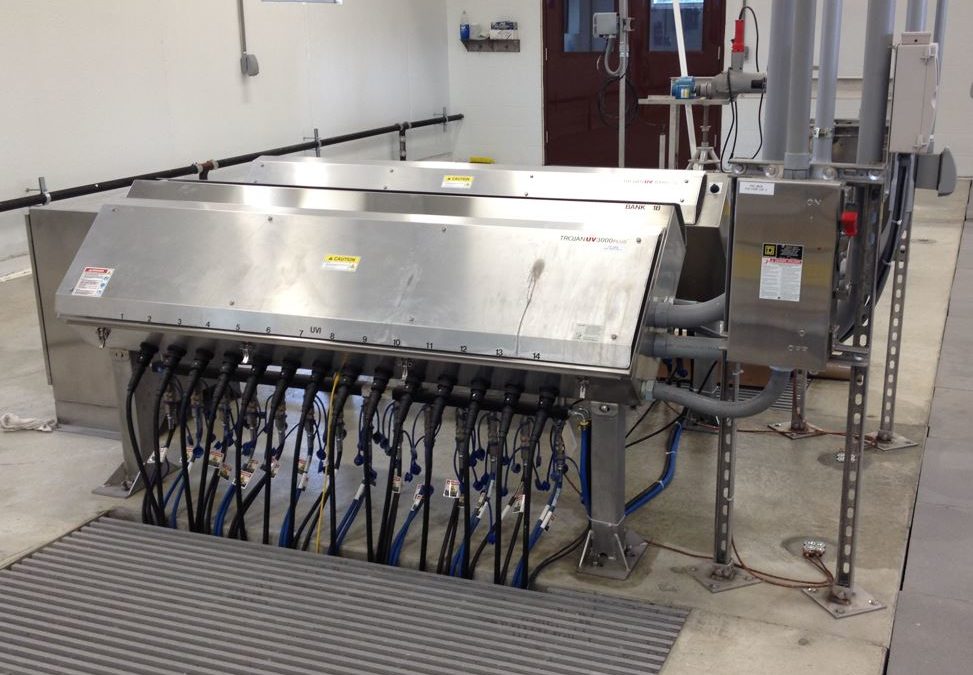
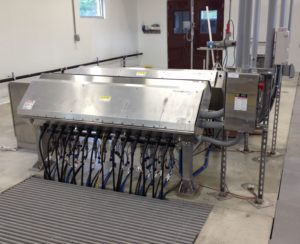
The effluent discharged to the river has gotten a lot cleaner since the Ames Water Pollution Control Facility built $2 million disinfection system using ultra-violet (UV) light. The system was completed in March of 2015. During the recreational season (March 15-Nov 15), treated effluent passes through two banks of lights that kill microbes. Prior to this, some E. coli and pathogens could make it through the system and end up in the river. Chlorination, a good solution for disinfecting drinking water and swimming pools, is not ideal for wastewater because it can harm fish.
Kris Evans, an environmental engineer for the City of Ames and the project manager, said this about the system:
“By using UV we continue to be “chemical free” for treatment of the wastewater and it’s much safer for staff since they don’t have to chlorinate and dechlorinate. When flow is low at the plant, we are able to lower the intensity of the bulbs to save energy and still meet permit limits; as flow increases so does the UV light intensity. The City started design of the UV system before it was mandated in a permit; we knew it was coming, but wanted to be proactive in the treatment of water, making it safer for those who recreated in the river. It was also the first project the department funded through an State Revolving Fund (SRF) loan.”
We still see high E. coli levels in other streams that receive effluent, but smaller wastewater treatment systems are also making the switch to comply with new permit requirements. In Story County, Gilbert added a UV disinfection system in 2019, the Squaw Valley HOA completed theirs in 2020, and Nevada will build a new wastewater treatment plant in 2022 that includes UV disinfection.
* I’ve written before about the challenges of detecting water quality trends. I’m pleased to report that two of the trends discussed here (a reduction in phosphorus at mid-range flow conditions, and a reduction in E. coli in dry and low-flow conditions) were statistically significant at 90% confidence level, using a test of the difference between medians. The approach employed here (sorting by flow conditions) may be a good way to control for weather and reach more reliable conclusions. It’s exciting to have some good news that holds up to further analysis!
During a long period of dry weather like we’ve been having, some rivers are cleaner than usual, some are just as dirty. It depends on which pollutants we’re talking about, and where they’re coming from. Understanding which is which can help us diagnose problems and prioritize solutions.
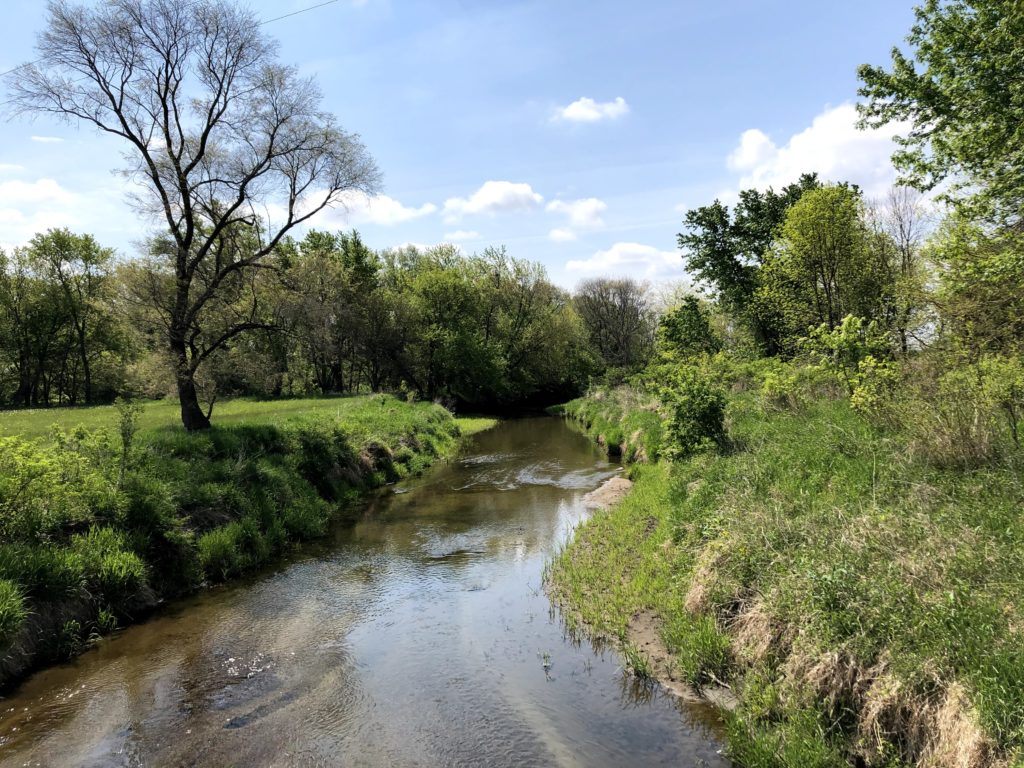
The South Skunk River upstream of Ioway Creek is at its cleanest (clear and with low E. coli) when the weather has been been dry. If you’re going to let your kids splash in the water, go here.
Ioway Creek is less muddy but not any cleaner (high E. coli levels) when the weather has been dry and water levels are low. Lots of algae this summer, too.
For example, if a stream has high E. coli levels when water levels are low, that’s probably not because of manure carried in agricultural runoff… because when the soils are this dry, what little rain we get soaks in and doesn’t run off. Under dry conditions, more likely sources are things like cows in the stream or a septic system illegally hooked up to a drainage tile(yes, we’ve seen this happen). We’ll discuss wastewater treatment plants next time.
The figure below, from the cleanup plan (TMDL) for the Iowa River basin, matches E. coli sources to flow conditions. These kind of graphs take some explanation, but it’s a really helpful framework for making sense of water quality data.
The categories on the x-axis are based on percentiles. “High flows” are the top 10% of daily average flows in a given record. Looking at the last 20 years of data from the USGS gage on the W. Riverside Rd. in Ames (Sleepy Hollow Access), that corresponds to at least 5,453 cubic feet per second of water–probably too fast for safe paddling. “Dry conditions” are the 90th to 60th percentile, corresponding to between 10 and 70 cfs of water–definitely not enough water for paddling.
When graphing stream flow or E. coli, we often use a logarithmic scale, where each major tick mark is a ten-fold increase. Since flow can range from 0 to 10,000 cfs in a river like the South Skunk, it’s the only way you can read it.
Boxplots are helpful for seeing summarizing the data. The bottom, middle line, and top of the box represent the 25th, 50th, and 75th percentiles.
In the upper stretch of the South Skunk River, measured at Sleepy Hollow Access, if you take your canoe out during mid-range conditions, it’s more likely than not that E. coli will meet the primary contact recreation standard (the center line on the box, the median, is below the orange line). It’s even cleaner in dry conditions. Paddlers would benefit from attention to E. coli sources that show up under “wet conditions” such as manure carried in agricultural runoff.
In Ioway Creek at Lincoln Way, E. coli is likely to exceed the secondary contact standard under mid-range conditions, and it’s usually exceeds the primary contact standard across all conditions. Kids play in this creek, and they would benefit from some attention to sources of bacteria that show up under “dry conditions”: this could include inspecting septic systems and working with cattle producers to fence cows out of streams.
Excuse the delay in posting the data. I had shared this with the participating volunteers but not with a broader audience. I was distracted by the dramatic change in water quality a week later. However, the results from the spring snapshot event is more typical of what we’ve been seeing this year–clear and drying up!
On the weekend of May 15, fifteen volunteers tested 25 sites on Ioway Creek and its tributaries.
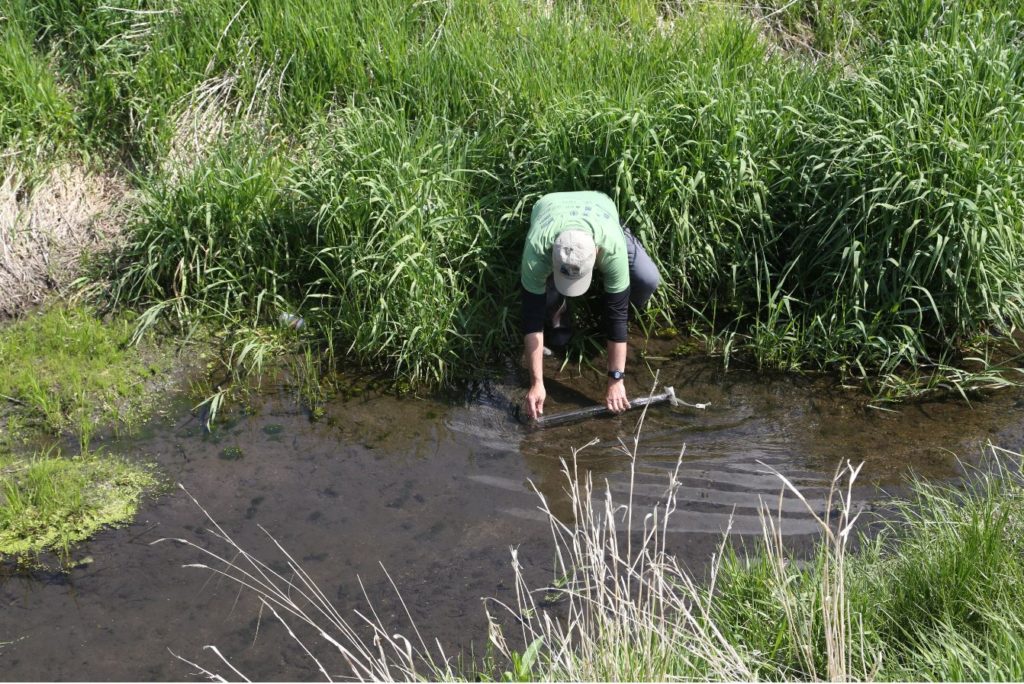
Volunteers practice testing phosphate and dissolved oxygen.
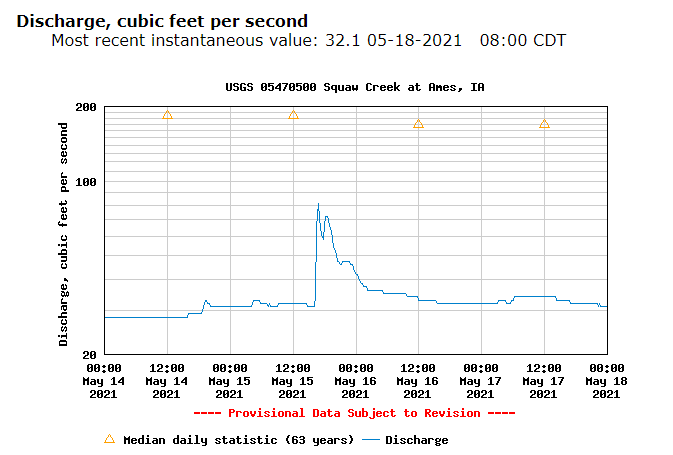
Like most of 2021 so far, water levels were way below normal, and light rains Saturday afternoon did little to change things. A few volunteers tested their sites Sunday, but water levels had dropped back down by the time.
Water levels (blue) in Ioway Creek are below normal (triangles).
With streams running low and tiles not flowing at all, most sites were as clear as we can measure (transparency greater than 60 cm), had low nitrate (2 mg/L or less) and low phosphate (0.1 or less).
But there were a few interesting exceptions.
Nitrate concentrations were a little higher (5 mg/L) in the middle reaches of Ioway Creek, starting at Hwy E18 in Boone County and continuing to Moore Park in Ames. The upstream reaches in Hamilton County and the downstream reaches in Ames had low nitrate levels.
“Gilbert Creek” had higher nitrate (5 mg/L) and much higher phosphate (1 mg/L) than other sites. When streams are running low, effluent from wastewater treatment plants can make up a significant portion of streamflow and can have a big influence on water quality. When streams are running high, effluent becomes a small fraction of streamflow compared to runoff from cropland. Wastewater plants in Iowa are only beginning to install technology to improve nitrogen and phosphorus removal.
The upper reaches of Ioway Creek in Hamilton County. Good water quality on May 15, but warm, not much shade.
Some urban streams showed elevated chloride levels (125 mg/L), but still within Iowa standards for aquatic life (389 mg/L thresholds for chronic exposure). Road salt dissolves and makes its way into groundwater, so we can see it’s influence in spring and summer, but testing before and after winter storms can give us a clearer picture.
The little creek below Ames High School (SC23) had muddy water (transparency of 32 cm) and dissolved oxygen low enough to harm aquatic life. We know that when it does rain this creek gets a lot of stormwater runoff (the video we produced with City of Ames shows this in action) and construction could also be an influence.
I don’t have a good explanation for lower dissolved oxygen and transparency at other locations.
Filling a transparency tube in Montgomery Creek, one of the murkier sites this year.
Thanks to our volunteers for spending a morning testing water! Our next event will be in October.