I don’t mean to throw shade on the staff at environmental agencies or the Clean Water Act. The 1972 law is the reason why American rivers mostly don’t burst into flames anymore. Some lakes and rivers in Iowa have benefited from the process described above, which results in technical information, stakeholder engagement, and grant funds that can help improve water quality. One example I’m familiar with is Hickory Grove Lake in Story County, which is now on its way to recovery. However, many other water bodies have gotten stuck somewhere in the process. I’ll share some examples from Central Iowa.
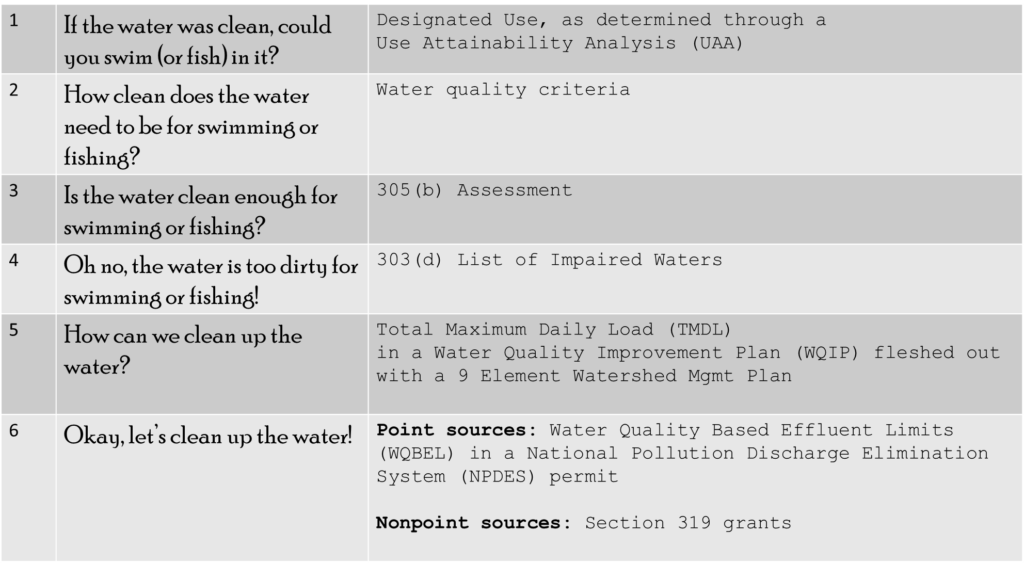
Step One: If the water was clean, could you swim or fish in it?
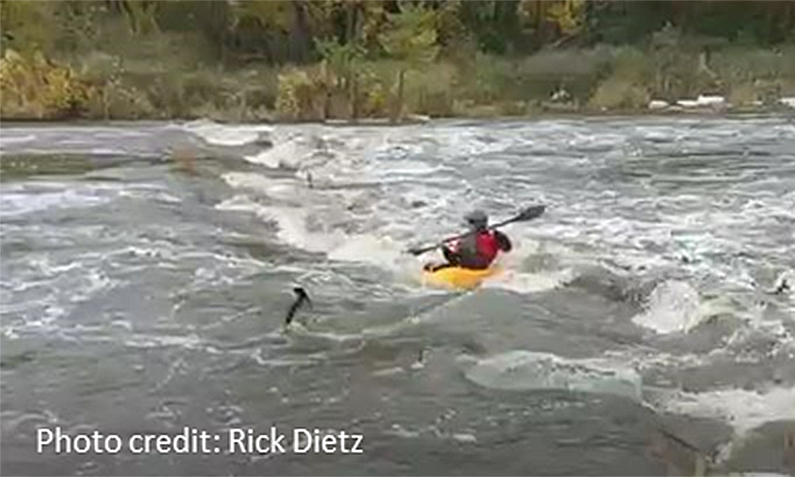
The goal of the Clean Water Act was for our waters to be swimmable and fishable by 1983 (yes, we missed that deadline). “Designated uses” for each lake and stream segment clarify what kind of recreation or aquatic life is possible, and these affect which water quality criteria are applied. For example, the Iowa River at Eldora has plenty of water for fishing, swimming, and paddling (so is designated A1 B-WW1). The South Skunk River at its headwaters near Blairsburg is too shallow for any of these uses, regardless of water quality (so is designated A2 B-WW2). As a result of this difference in designated uses, the Eldora Wastewater Treatment Plant must meet stricter E. coli and ammonia limits than the Blairsburg Sewage Treatment Plant.
However, perhaps one-half of the waters in the database have an asterisk next to the designated use. Most smaller creeks in Iowa are presumed to support primary contact recreation until the IDNR determines otherwise, through on-site investigation and surveys of residents. For example, Long Dick Creek in Hamilton County does not have enough water to float a canoe, but since no permit is affected by this determination, Iowa DNR has never been asked to find out. If they did a use attainability analysis, Long Dick Creek would probably not be on the Impaired Waters List — it has E. coli levels exceeding the primary contact standard, but below the secondary contact standard. For this creek, both the impairment and the protections provided by the Clean Water Act are hypothetical.
When a use attainability analysis is done, the conclusions can be confusing. I had understood secondary contact recreation to mean “shore-fishing” but is often paired with a designated use for aquatic life that implies there are no fish worth catching. I had understood primary contact recreation to mean “deep enough for canoeing”, but IDNR uses it to mean “deep enough to accidentally go swimming if you tip your canoe”.
Step 2: How clean does the water need to be for fishing and swimming?
Here’s an example of how the factual questions about the condition of Iowa’s waters get tangled up in economic and legal questions about how to address it. We know that algae blooms can kill fish and become a nuisance (or a safety issue) for swimmers and boaters. We know that phosphorus and nitrogen contribute to algae blooms in Iowa waters. We have lots of data about nitrogen and phosphorus in Iowa waters. We even had a study by IDNR staff examining the relationship between nutrients and aquatic life. What we still don’t have is numeric criteria to translate nitrogen and phosphorus data into “fully supporting”, “partially supporting” or “not supporting” for fishing and recreational uses of lakes and rivers.
Why? Because water quality criteria are not just used to make sense of the data; they are also used to regulate wastewater treatment plants. Iowa’s Environmental Protection Commission has rejected calls to establish numeric nutrient criteria because they were concerned it would put too heavy a cost on municipalities. It’s a valid concern — one that other states have dealt with through permit variances and nutrient trading systems.
Step 3: Is the water clean enough for fishing or swimming?
Assessments are done every two years using recent (but not current) data. The 2022 cycle uses data from 2016 to 2020.
Don’t expect a comprehensive list. Iowa has many lakes and streams and Iowa DNR does not have the resources to monitor them all. Almost one-half of the waters (49% of the river segments, 48% of lakes and reservoirs, and 18% of wetlands in the database) were not assessed for the 2022 cycle.
Even this is overstating how much we know. Most waters are assigned a designated use reflecting what kind of recreation is possible (Class A) and what kind of aquatic life is possible (Class B). The IDNR has conclusive enough data to say whether or not aquatic life uses are supported for 21% of river segments and 33% of lakes and wetlands. IDNR has conclusive enough data to say whether Recreational Uses are supported for 19% of river segments and 57% of lakes and wetlands.
Step 4: Oh no, the water is too dirty for fishing or swimming!
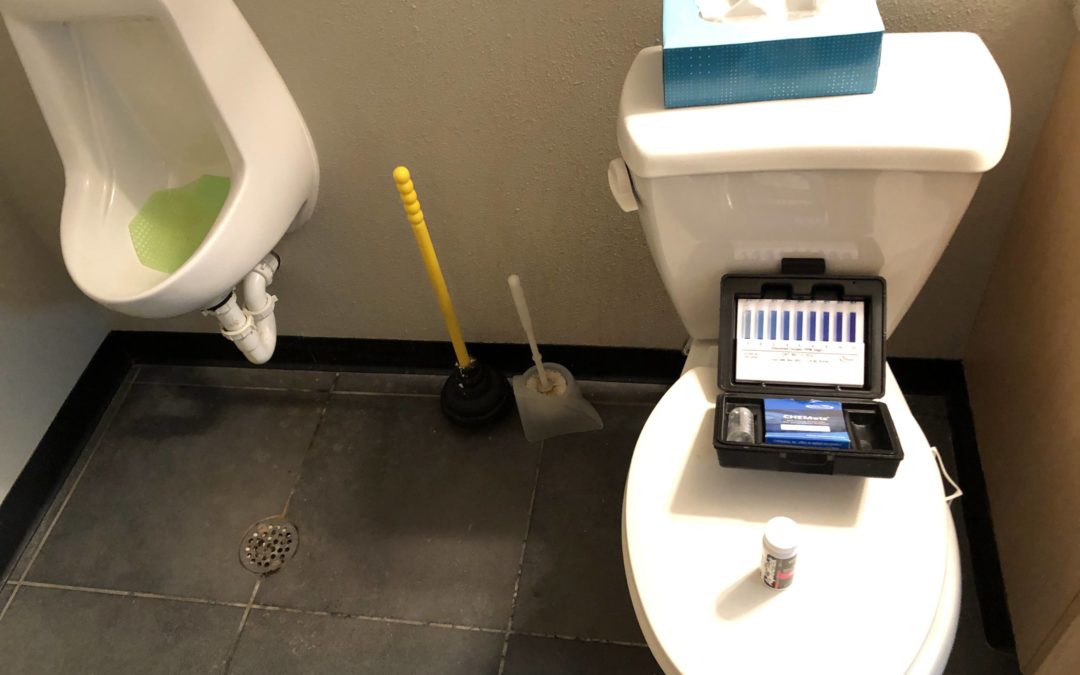
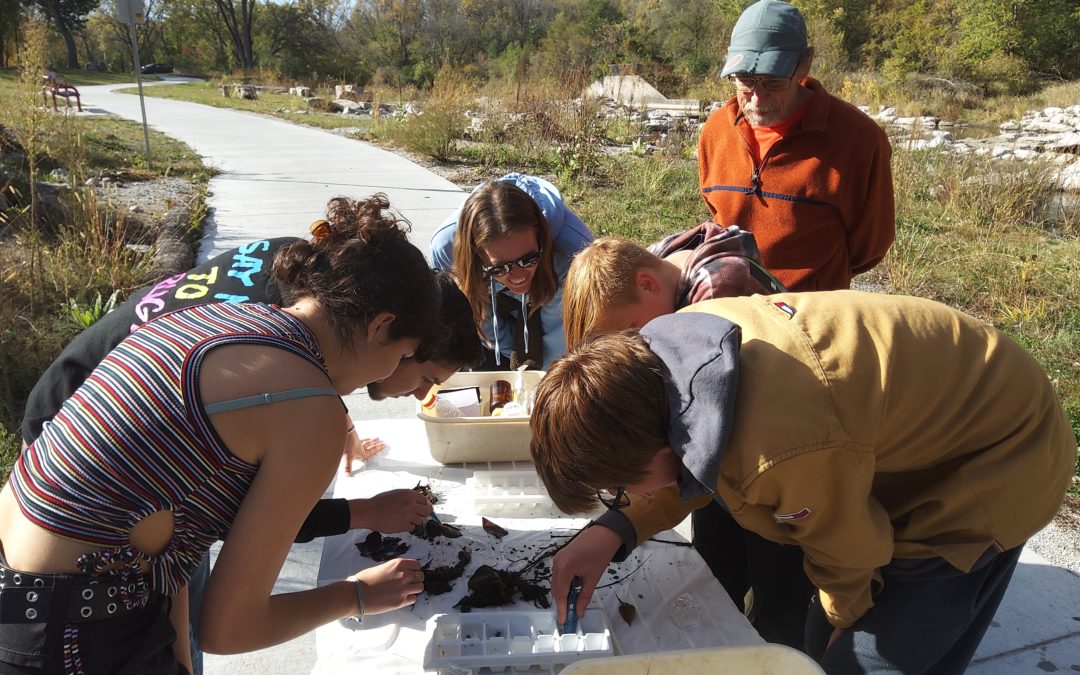
Local groups are doing water quality monitoring and could help the IDNR assess more water bodies. For example, Prairie Rivers of Iowa and our partners documented E. coli levels in Ioway Creek that were 18 times higher* than the standard! However, since our data was not collected under an IDNR-approved quality assurance plan (and since IDNR rarely approves such plans), the most they can do is put Ioway Creek on a list of “Waters in Need of Further Investigation” (WINOFI). If not for a state law (the Credible Data Law), the Impaired Waters List might be much longer and more worrisome.
*The South Skunk River between Story City and Ames is still on the Impaired Waters List because in 2014, the average (in this case, a geometric mean) E. coli count for the season was 223 colonies per 100mL, almost twice the primary recreation standard (126 colonies/100mL). In Ioway Creek in Ames, Prairie Rivers and our partners documented an E. coli geometric mean of 2,280 colonies/100mL in 2018.
Step 5: How can we clean up the water?
The 303(d) list is not just an embarrassment for the state of Iowa. It’s also a waiting list for a water quality improvement plan. These plans are time-consuming to write, so the IDNR has to prioritize. Bacteria impairments in rivers are considered a lower priority, so the South Skunk River between Story City and Ames has been on the waiting list since 2004. It’s in good company: there are 594 stream segments, lakes, and wetlands that need a Total Maximum Daily Load (TMDL).
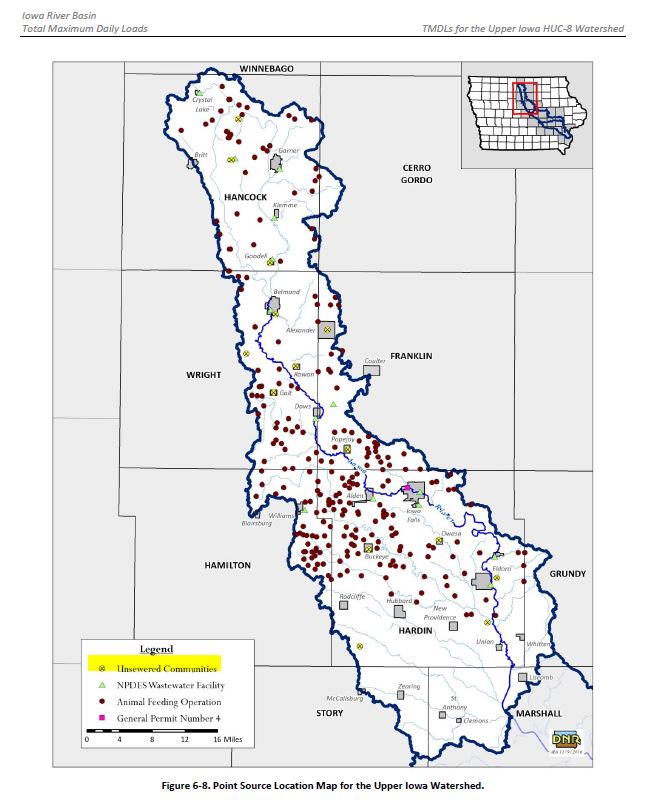
Step 6: Let’s clean up the water!
Some lakes and rivers have water quality improvement plans that were written over a decade ago and haven’t been implemented. I’ve read a few. In the case of the Little Wall Lake plan (2005), the report did not offer any good solutions, and maybe there aren’t any–it’s a shallow lake with a lot of phosphorus in the muck that gets stirred up when it’s windy. In the case of the Raccoon River plan (2008), solutions are recommended, but there are many obstacles to implementing them: both social (many farmers don’t want to) and legal (the Clean Water Act can’t make them).
How to get involved
You can comment on the Draft Impaired Waters List through March 19, 2022, by mailing a letter to:
Iowa Department of Natural Resources
Attention: IR Comments
Water Quality Monitoring & Assessment Section
Wallace State Office Building
502 East 9th Street
Des Moines, IA 50319
Or send an email to: IRcomment@dnr.iowa.gov.
As I’ve said, we think the Impaired Waters List represents a missed opportunity to communicate with the public about threats and opportunities to recreation and fisheries in Iowa waters. We would welcome a discussion about how this gap could be filled.
 .
.