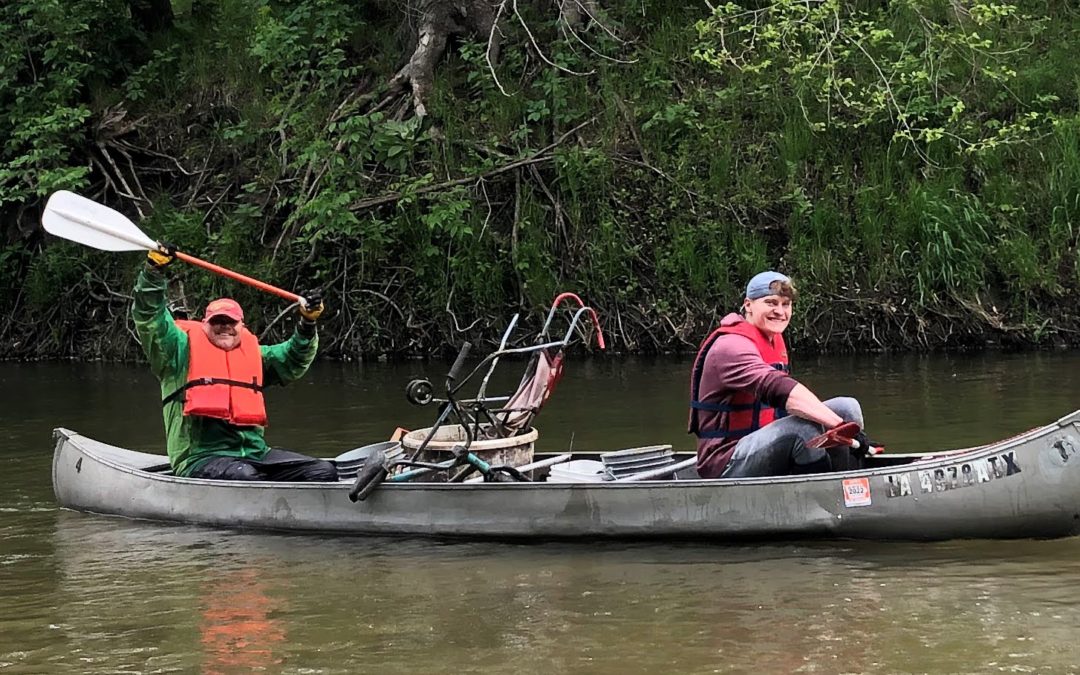
It’s Rude to Point, but…
By my calculations, over 65% percent of the nitrogen load in Ioway Creek on May 20 came from less than 1 percent of the land area in the watershed. We still don’t know why.
Revised May 31
Many people assume that fertilizer applied to turf grass is a major source of nitrogen and phosphorus pollution in Iowa. At a presentation to the Ames City Council, I was asked if a public awareness campaign aimed at lawn care professionals and homeowners would be an effective way to improve water quality in Ioway Creek. If we’re talking nitrogen, I don’t think so:
- Because turfgrass covers a tiny proportion of the land in most Iowa watersheds, compared to cropland.
- Because turfgrass is a perennial. Having something growing and taking up available nutrients year-round is the principle on which cover crops reduce nitrogen loss.
- Because there was a study by Dr. Keith Schilling that found very low nutrient levels in shallow groundwater below six Iowa golf courses.

To that list, I can add local water quality monitoring including lab testing and sensor results from May. Nitrate in Ioway Creek and the South Skunk River were the highest we’ve seen for a few years, but while rural tributaries ranged from 12-20 mg/L of nitrate, College Creek (an urban watershed with plenty of turf grass) measured only 2.3 mg/L.
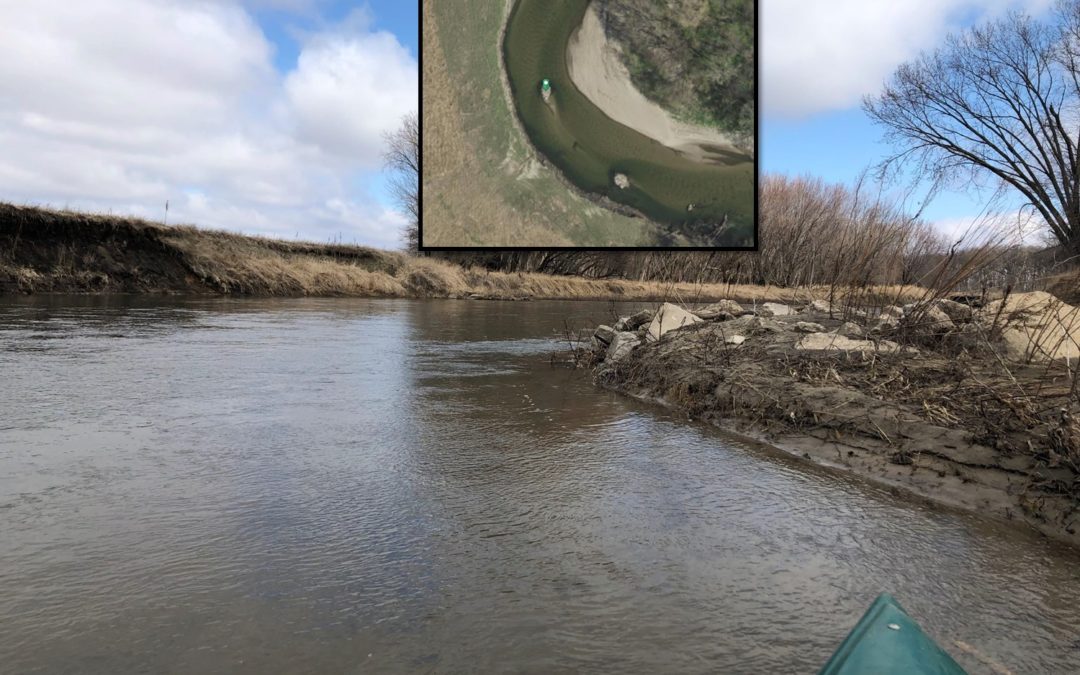
But even if turf grass in general isn’t a serious water quality problem, maybe some specific areas of turf grass are a problem. That’s what I thought after reviewing the data from our spring water quality snapshot on May 17. Volunteers found a big difference in nitrate levels between South Duff Ave and other sites in Ames. I wondered if it could be a mistake, so I went back out on May 20 with a bottle of test strips and a smartphone app that enables more precise measurements. It wasn’t a mistake (nitrate in Ioway Creek increased from 8.6 mg/L to 24 mg/L in two miles), but the results still weren’t making sense, so I kept testing and testing until I assembled the map below. By my calculations, 65% of the nitrate load in Ioway Creek that day was coming from just 1,500 acres!

The 1,500 acres includes Coldwater Golf Links, and the pattern looks like what I’d expect to see if the golf course was overapplying fertilizer. However, the golf course superintendent has informed me that fertilizer has not been applied since fall, and then only at a low rate. A volunteer tested two ponds on the course and found low levels of nitrate (1-2 mg/L).
The 1,500 acres include some developed areas north of creek drained by storm sewers, but I tested water trickling from two outfalls on May 20 and found very low nitrate levels: 0.5 mg/L and 3.1 mg/L.

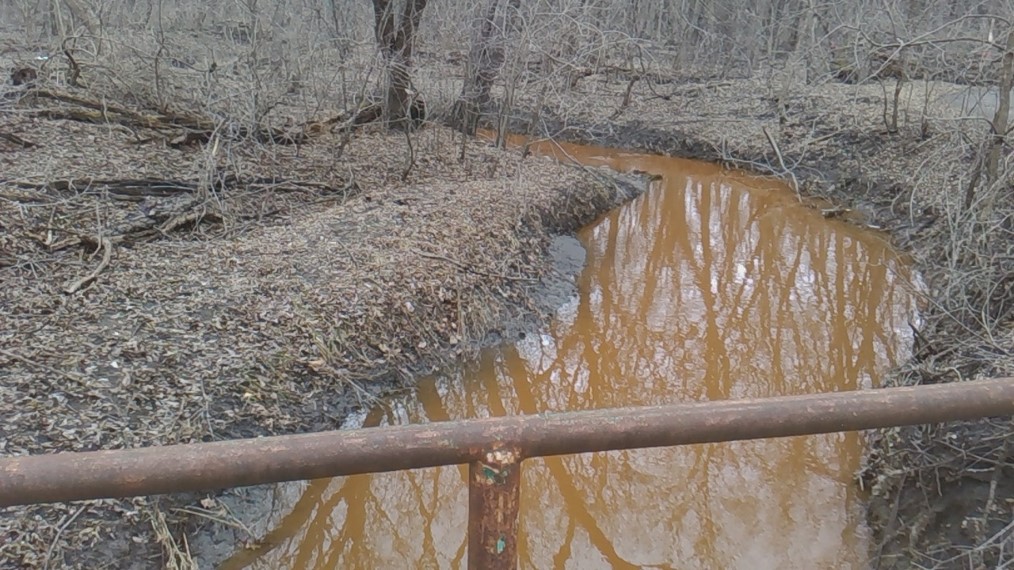
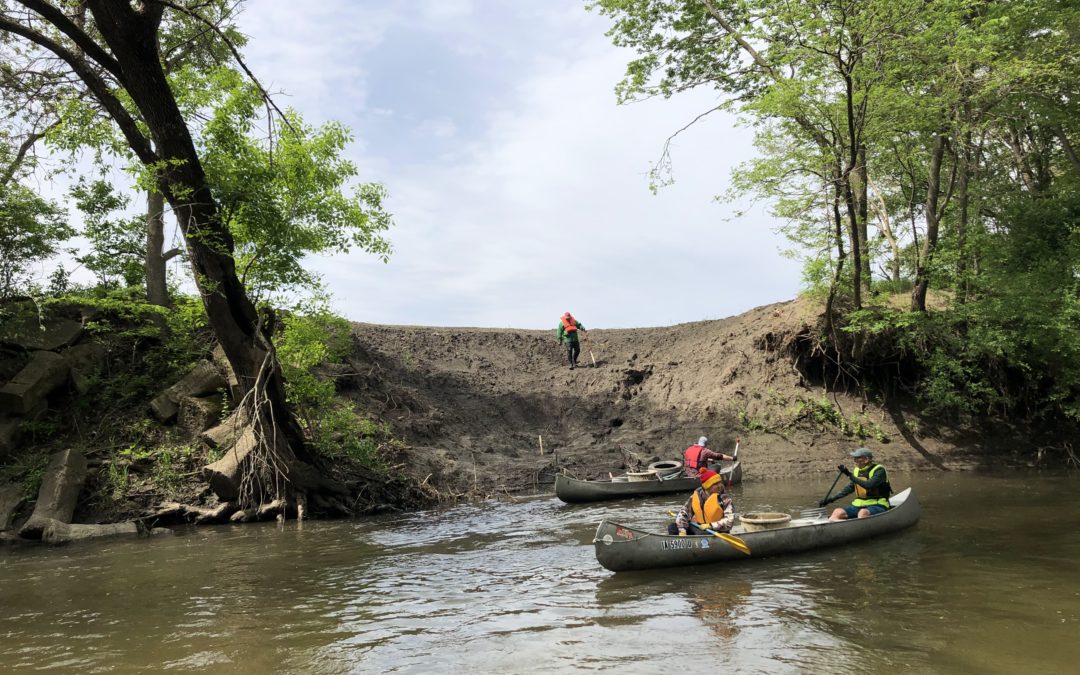
The 1,500 acres acres also includes two construction sites: a flood mitigation project near South Duff Ave and an ISU recreation complex east of Jack Trice Stadium. The photo shows severe bank erosion where drainage from the ISU construction site enters the creek. An inspector with the Iowa DNR noted problems with erosion control earlier this spring on the South Duff project. However, if the nitrate spike were linked to erosion, I’d expect to see high phosphorus and low transparency.
Honestly, I’m not sure what’s going on here. It’s not a pattern we’ve seen in previous years.

When interpreting this kind of data, there is a risk of jumping to conclusions and unfairly pointing fingers. In my first draft of this article, I suggested that Coldwater Golf Course was the source of the nitrate and the bank erosion. That was premature.
However, there is also a risk that we will waste time and money on the wrong solutions or the wrong areas if we don’t test water or don’t follow where the data is pointing. It’s clear from this month’s data and many other rounds of testing that water quality impacts are not uniformly distributed across the landscape.