It turns out that stream monitoring is quite compatible with social distancing. 28 volunteers participated in the Squaw Creek Watershed Coalition’s 13th spring water quality snapshot on May 30 and 31. Together we tested water quality at 43 sites on Squaw Creek, its tributaries, and the South Skunk River! This time, Prairie Rivers of Iowa assembled the equipment, organized the event, and entered the data. We’re happy to support this dedicated group of citizen scientists in better understanding and drawing attention to our local rivers and creeks.
Update: The name “Squaw Creek” was officially changed to “Ioway Creek” in February of 2021, to be more respectful to native peoples. Over the next year, expect to see some changes to the name of the Coalition, as well as maps and signs.
Here’s a few selfies taken by participants, a mix of long-term volunteers and new faces.

The Kopecky family by the South Skunk River
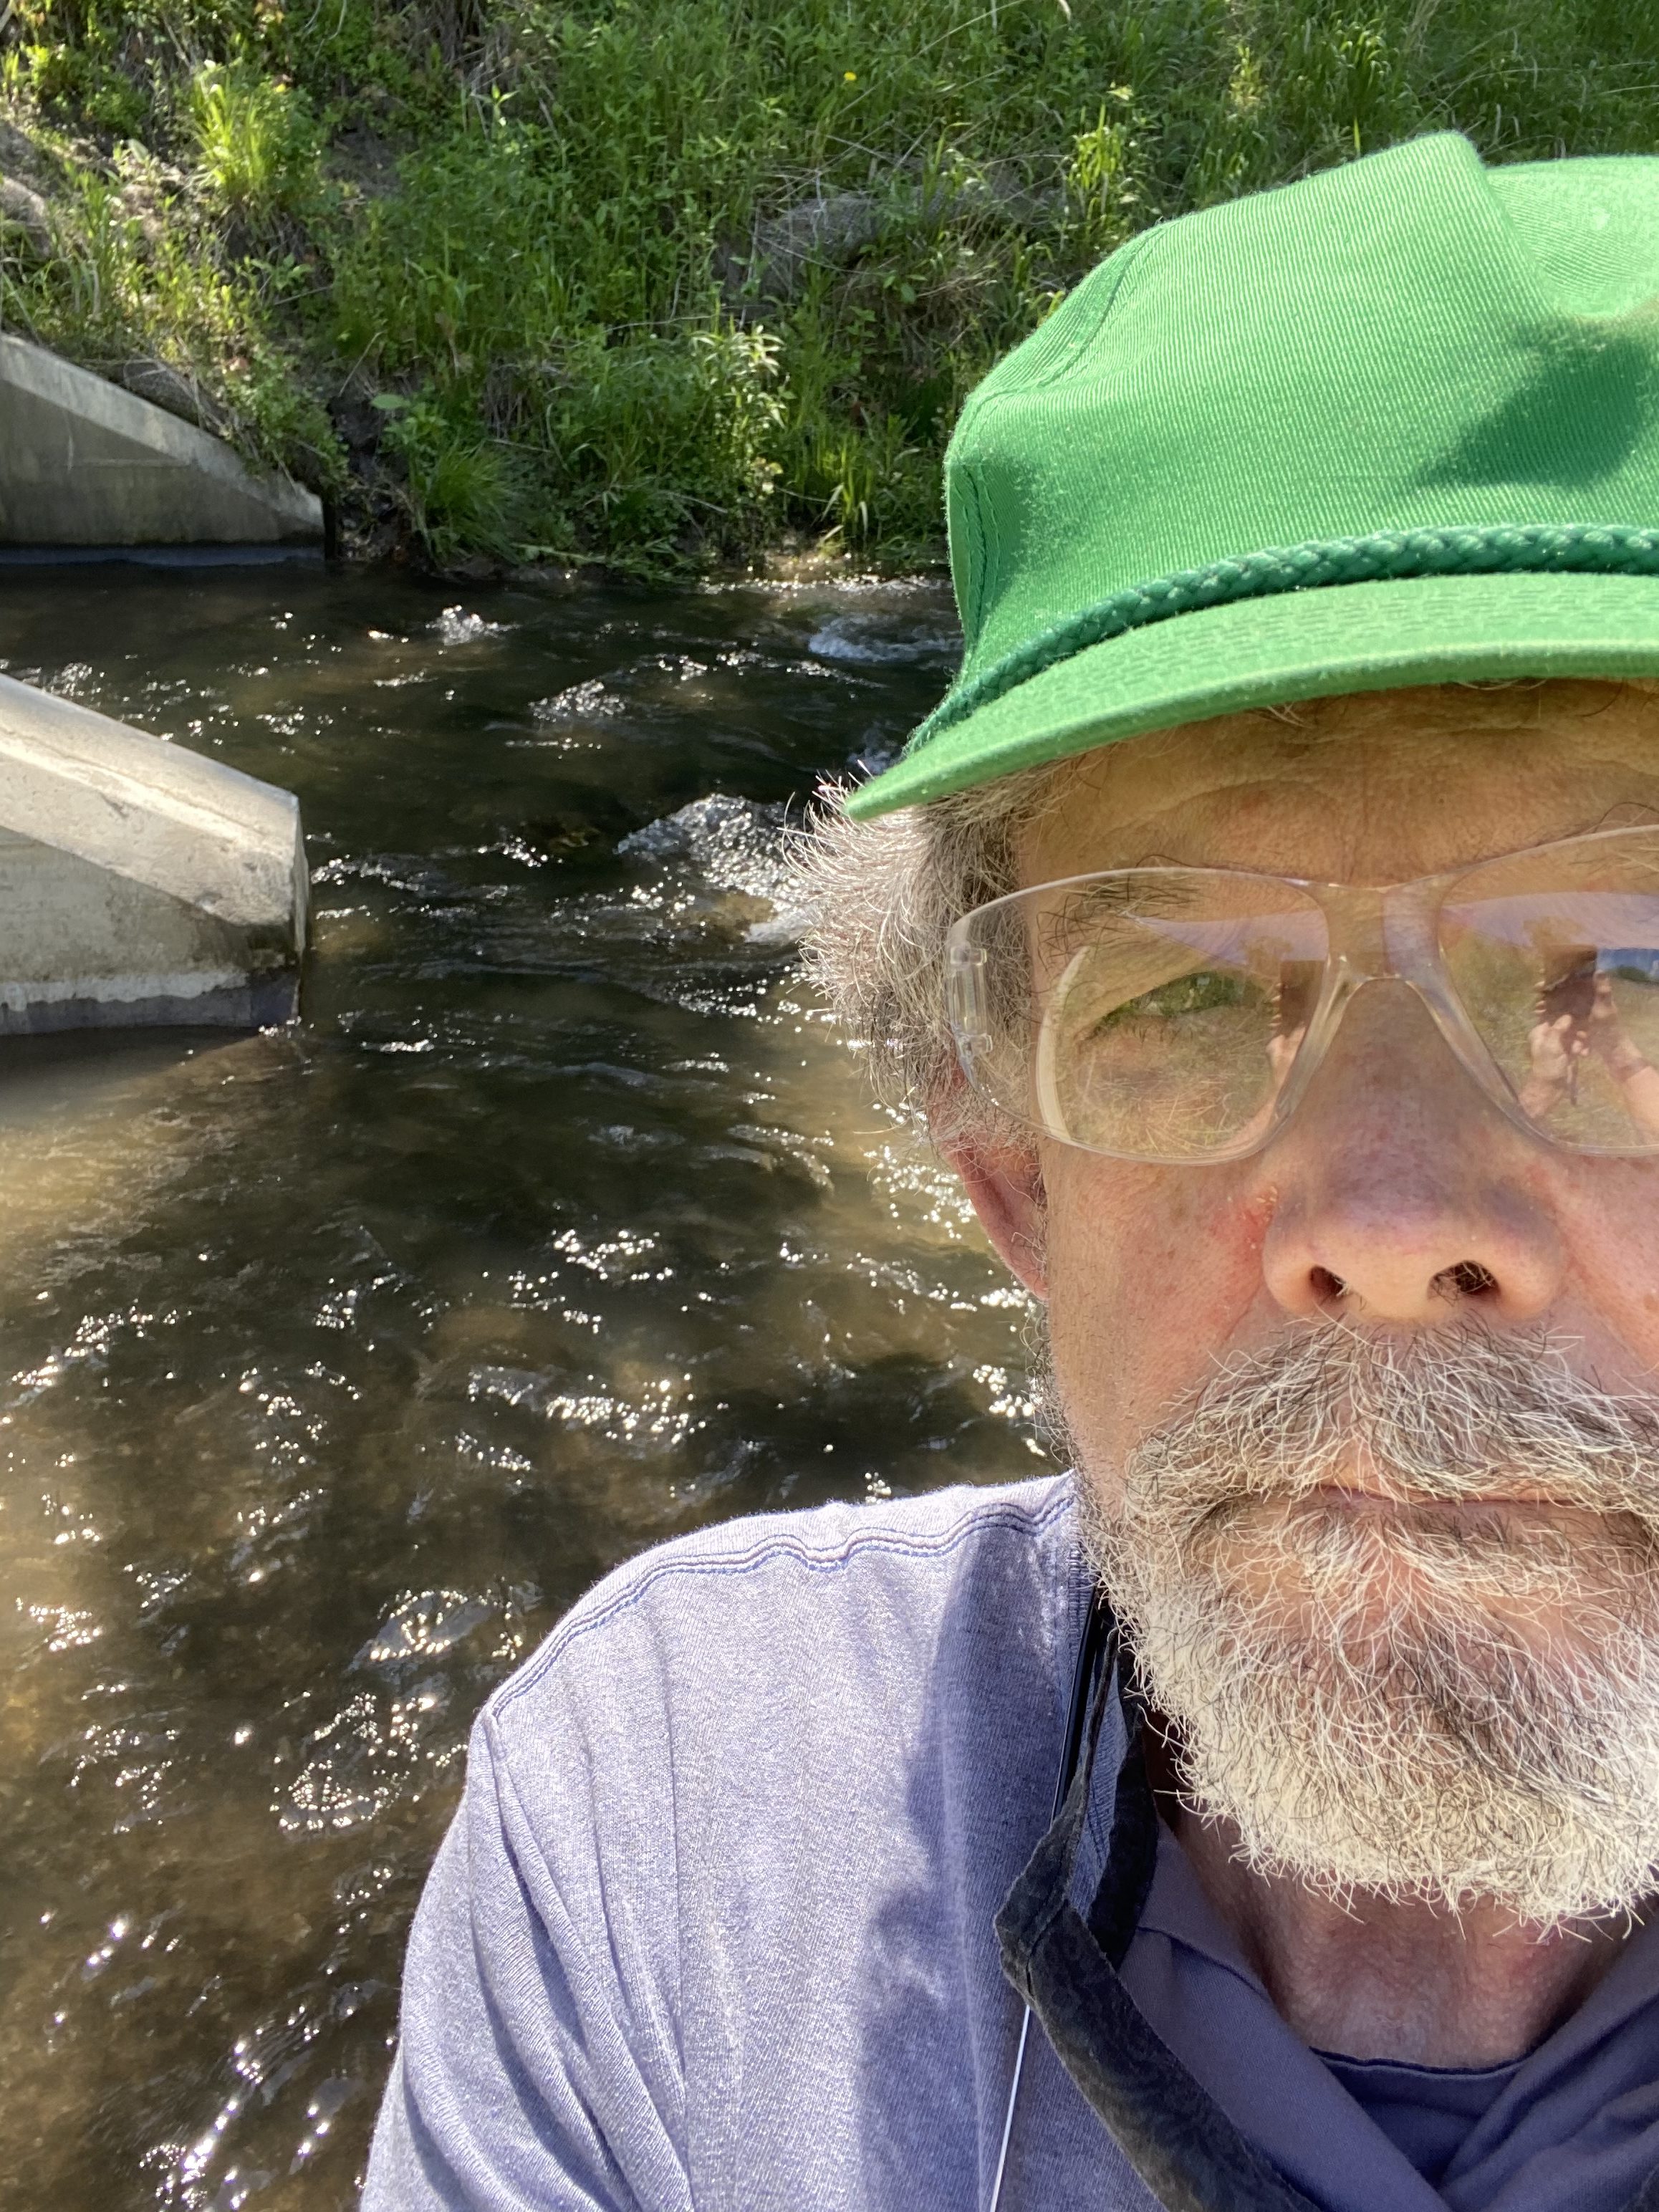
Jeff White at Gilbert Creek
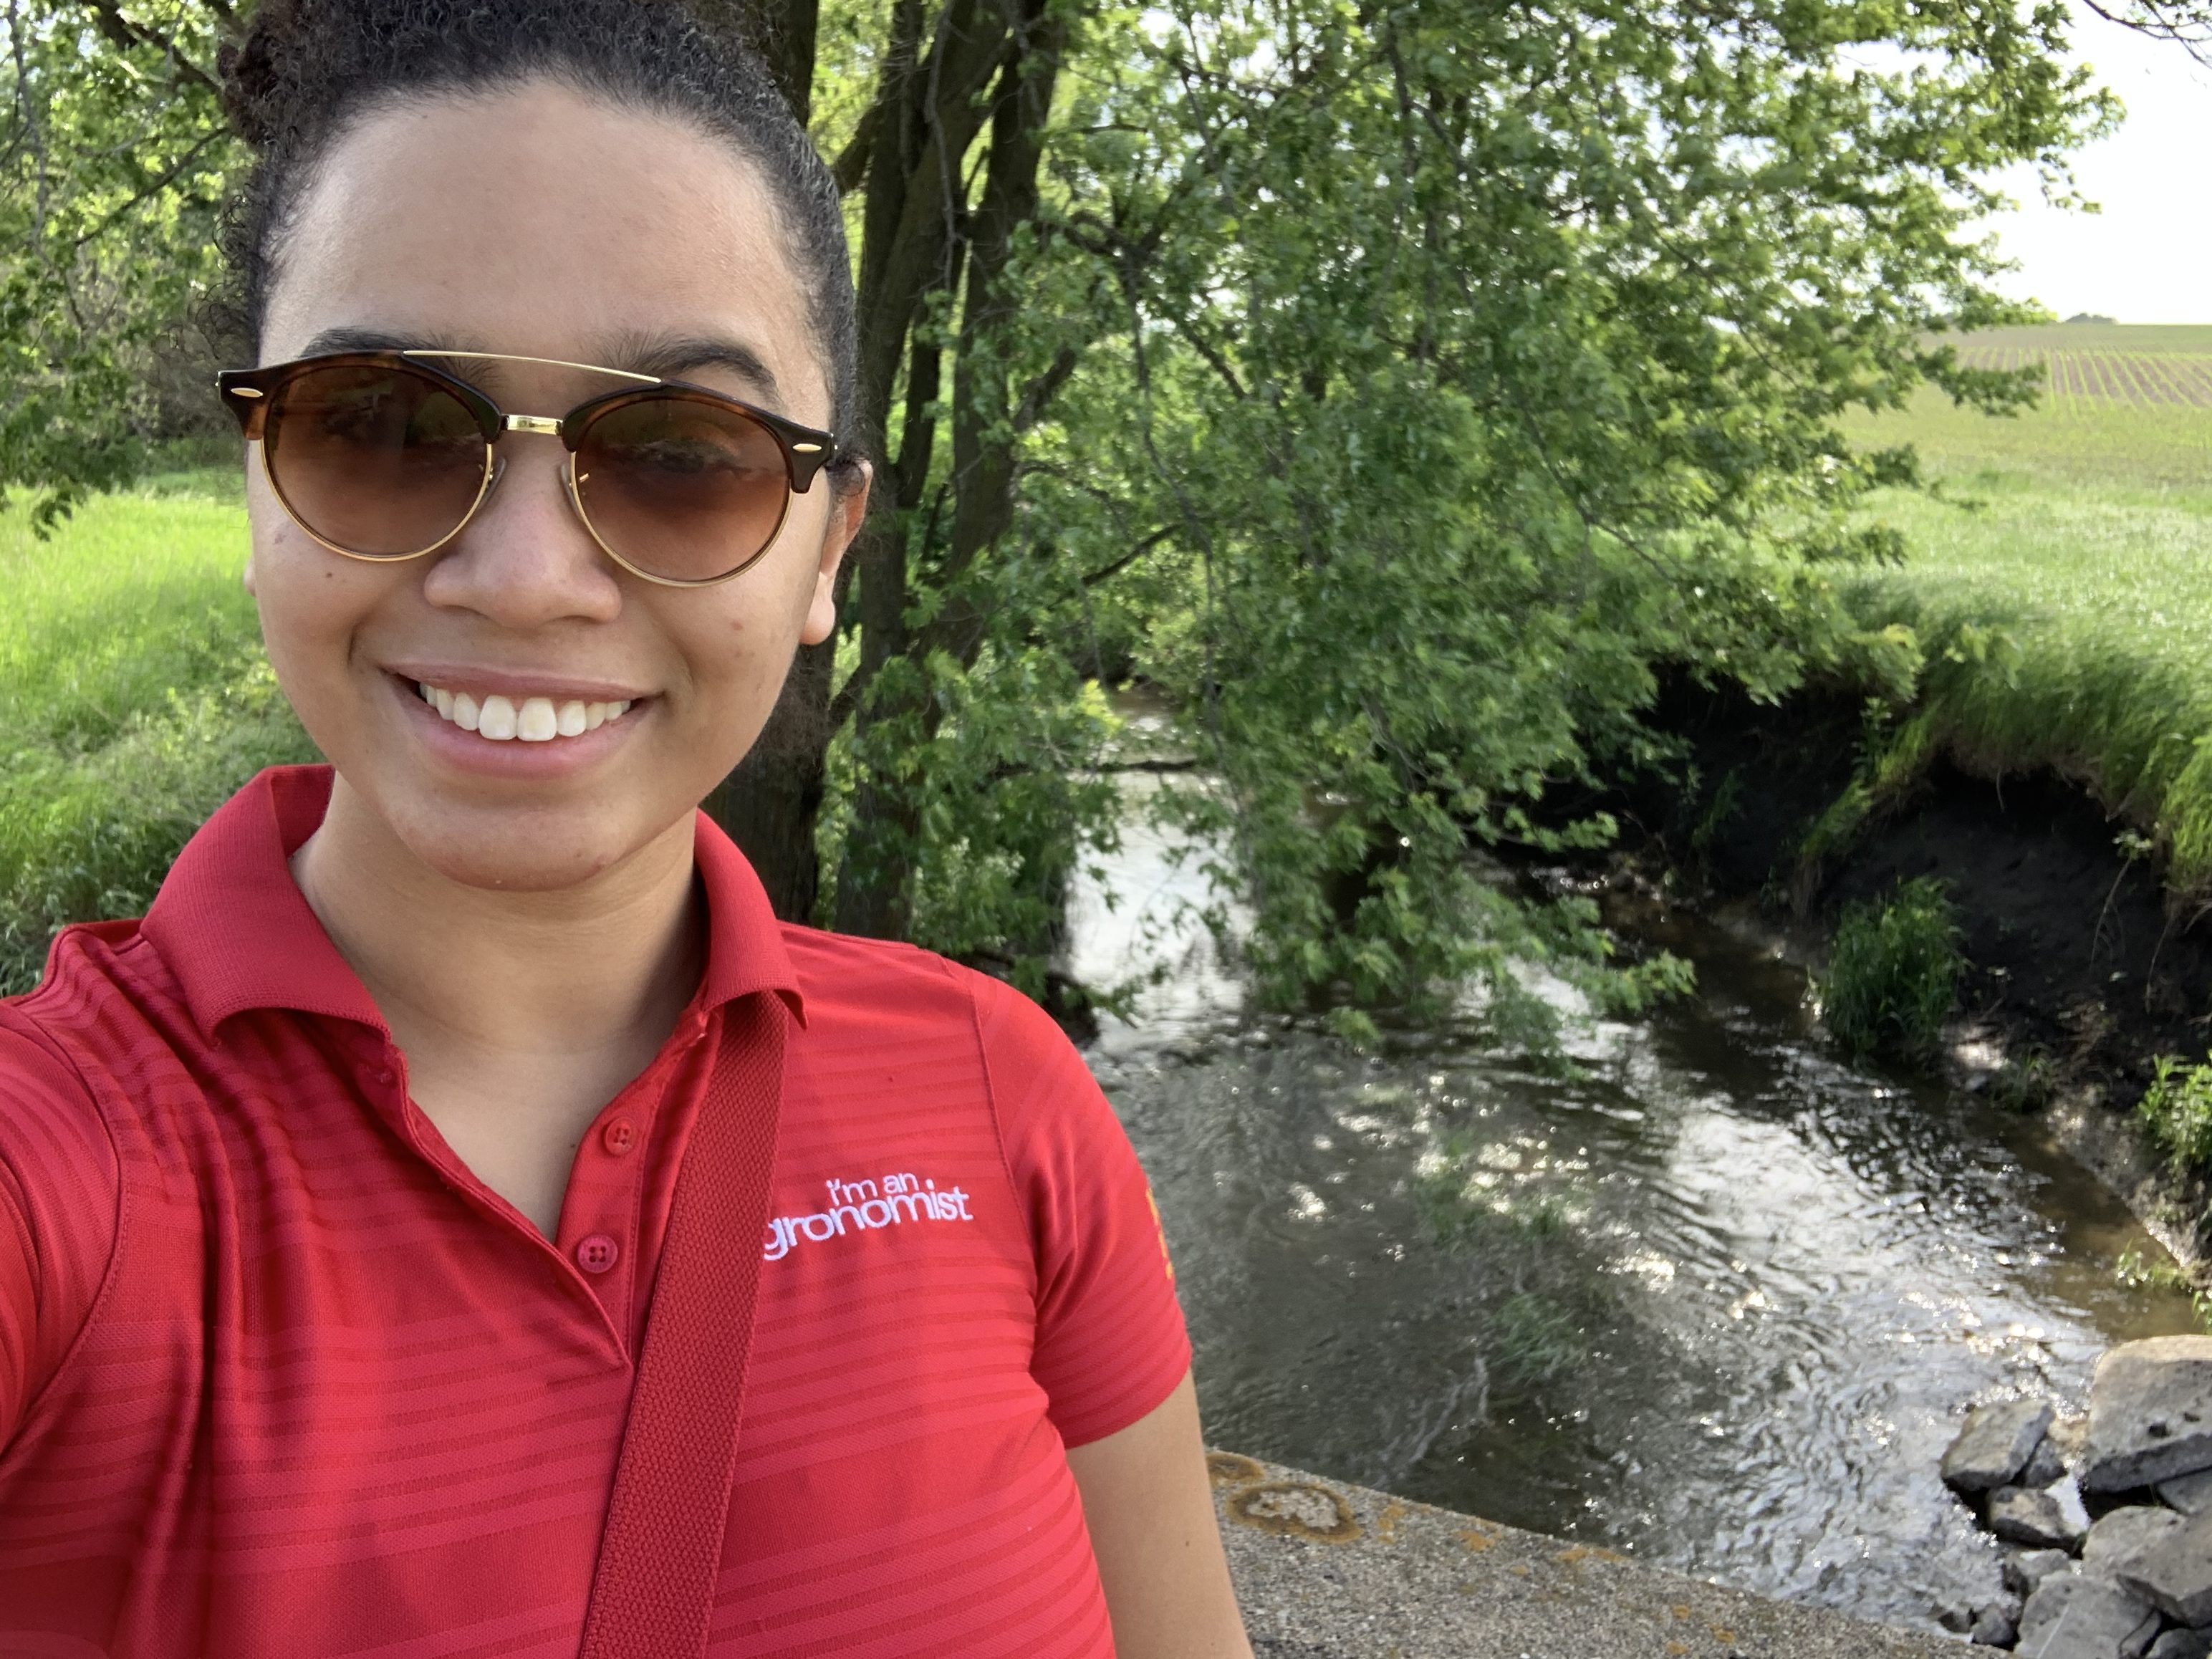
Kelly Nascimento Thompson at Glacial Creek

Kurt Plagge and Mary Burnet at Onion Creek
As the name implies, this is a snapshot in time. The water quality on one sunny weekend in May is not necessarily representative of the month, let alone the year. As described here and here, water quality can change dramatically in response to a big rainstorm. But for this moment in time, testing many sites gives us a very detailed picture of the Squaw Creek watershed.
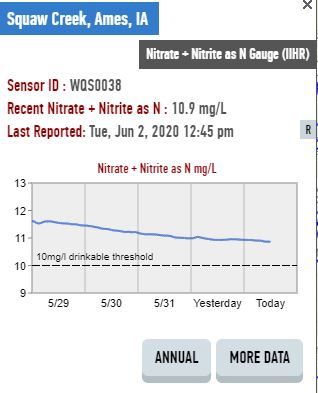
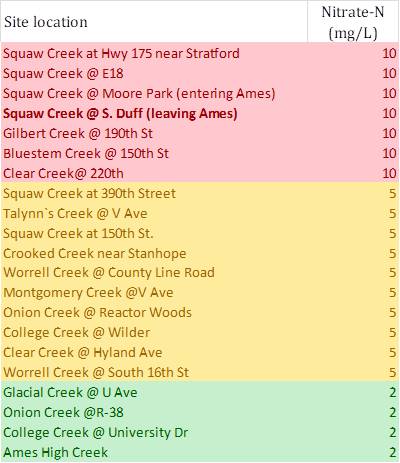
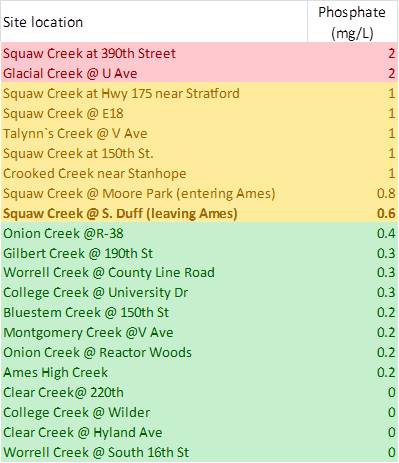
For example, during May 30 and 31, nitrate in Squaw Creek at Moore Park and other locations in Ames was quite high (11-12 mg/L) exceeding the drinking water standard (10 mg/L). Where is that nitrate coming from? All over its 147,000 acre watershed, but in some tributaries more than others, as you can see in the color-coded chart below. Nitrate was especially high in the upper reaches of Squaw Creek, Gilbert Creek and Clear Creek and especially low in Glacial Creek (which has a series of constructed wetlands and a lot of pasture) and College Creek (which has an urban watershed). The upstream, rural parts of College Creek and Clear Creek have higher nitrate, which appears to be diluted they move through town.
For phosphorus some of the patterns are flipped. Glacial Creek has especially high orthophosphate (the dissolved form of phosphorus) while Clear Creek is especially low.
There’s lots of interesting patterns to explore, and more data from this and previous snapshot events here. If you’re curious about water quality, subscribe to our blog, I’ll be continuing to interpret data from this and other sources.
Thanks to all our volunteers for collecting it!
Questions about stream monitoring, or observations from our volunteers? Post a comment.