Thirteen volunteers braved the cold on October 24 to test water quality in Squaw Creek, the South Skunk River, and their tributaries. For some, this was their 14th Fall Water Quality Snapshot. For others it was their first time doing stream monitoring. What we found defies easy categorization.
Update: The name “Squaw Creek” was officially changed to “Ioway Creek” in February of 2021, to be more respectful to native peoples. Over the next year, expect to see some changes to the names of the Squaw Creek Watershed Coalition and other groups that have formed to protect the creek, as well as maps and signs.
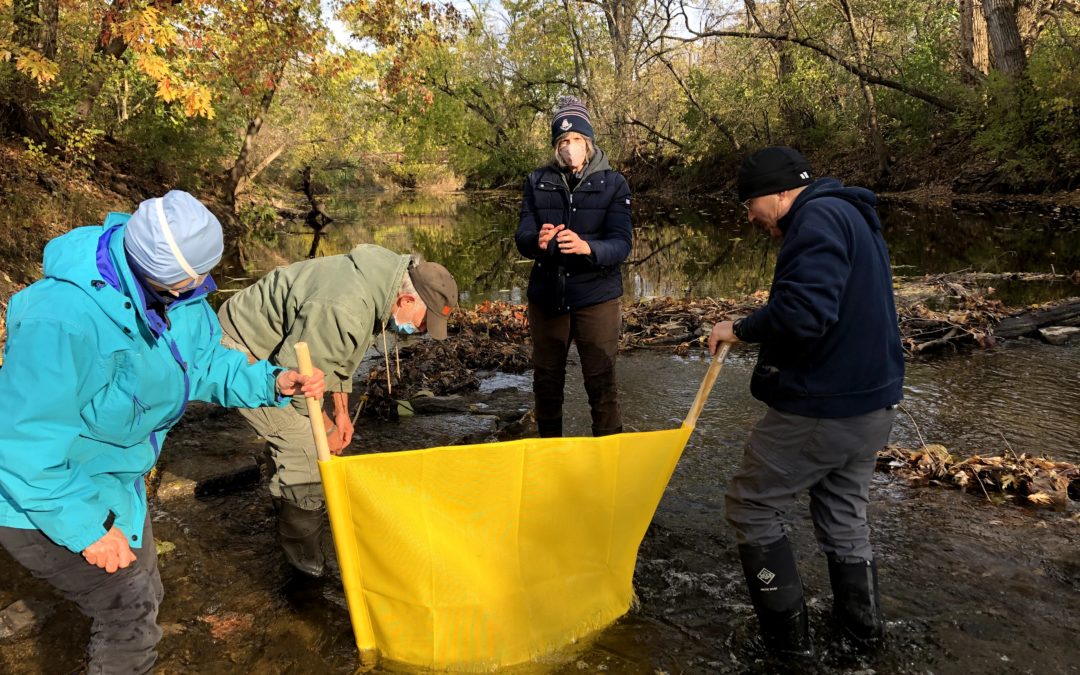
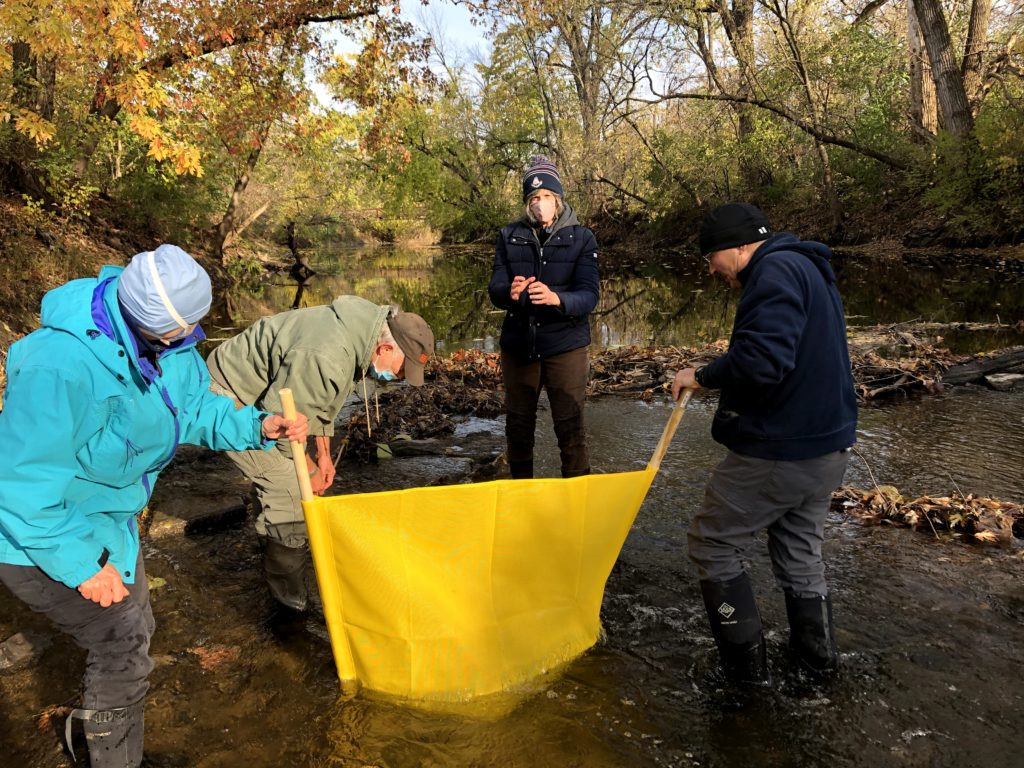
Volunteers Diane Birt, Paul Readhead, Liz Calhoun, and Rick Dietz take turns brushing off rocks to capture bugs in our net. The water was freezing!
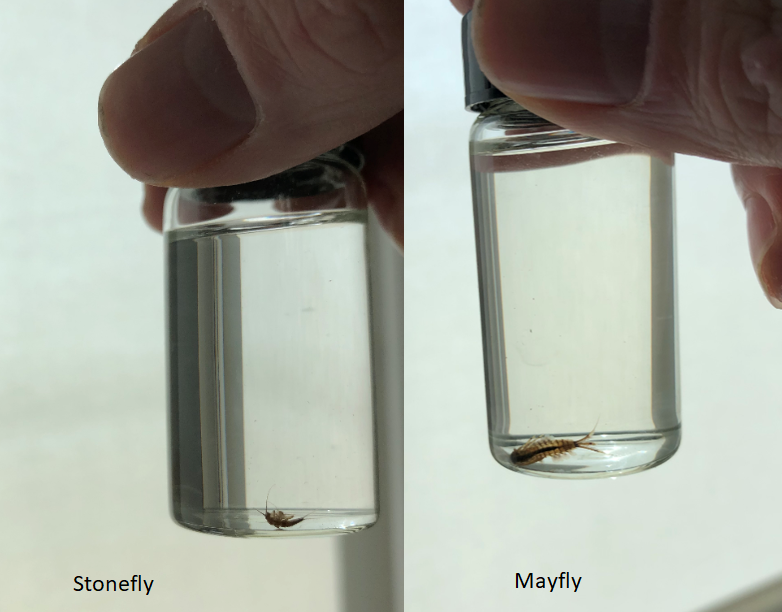
By some indicators, water quality in Squaw Creek was good. Since I wasn’t sure how many creeks would be flowing when I planned this event, I added bug collection to the agenda to keep us busy. Excuse me. Benthic macroinvertebrate sampling. We were pleased to find tiny stoneflies and mayflies. They’re good fish food, ask any fly fisherman! Excuse me. An important part of the aquatic food web. These insects also act as a sort of canary in the coal mine. They need water with a lot of dissolved oxygen so will be rare or missing in streams with too much pollution, murky water, or not much in the way of habitat.
Fun fact: while the adult mayfly is notorious for living only 24 hours, the juvenile form (naiad) lives in the stream for several years. If you’re curious what adult mayflies and stoneflies look like, I found somephotos from our neighbors in Missouri.
By some indicators, water quality in Squaw Creek and it’s tributaries was bad. As in, there’s poop in the water. Excuse me, fecal indicator bacteria. This month, E. coli bacteria in Squaw Creek continued to exceed the primary contact recreation standard, and College Creek jumped above secondary contact standard. I wondered if this spike might be due to accumulated… debris… being washed out of the storm sewers and off the landscape by the 1.25 inch rain we received Thursday and Friday, but the lab samples were actually collected on Wednesday Oct 21, so I’m not sure. Anyway, covid-19 is not the only reason I bring hand sanitizer to these events!
By some indicators, water quality was unusually dry this fall. Nitrate was too low to detect at 13 of 16 sites we tested. Under wetter conditions, as we had this spring or last fall, nitrate in these same streams was higher and differences due to landuse or conservation practices in the watershed become more apparent.
Site
Watershed
Fall 2020
Spring 2020
Fall 2019
Squaw Creek @ Duff Ave
Rural and urban
0
10
5
Bluestem Creek @150th St
Rural
2
10
5
Glacial Creek @ U Ave
Rural (with a constructed wetland)
0
2
2
College Creek @ University
Urban
0
2
2
Nitrate-N concentrations, in mg/L
Water quality is rarely all good news or all bad news. Citizen science can us a more complete picture.
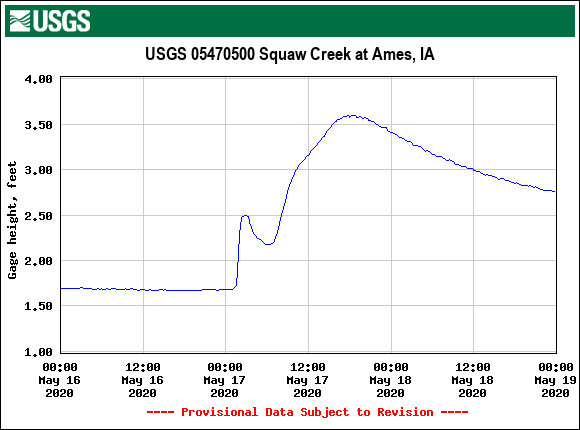
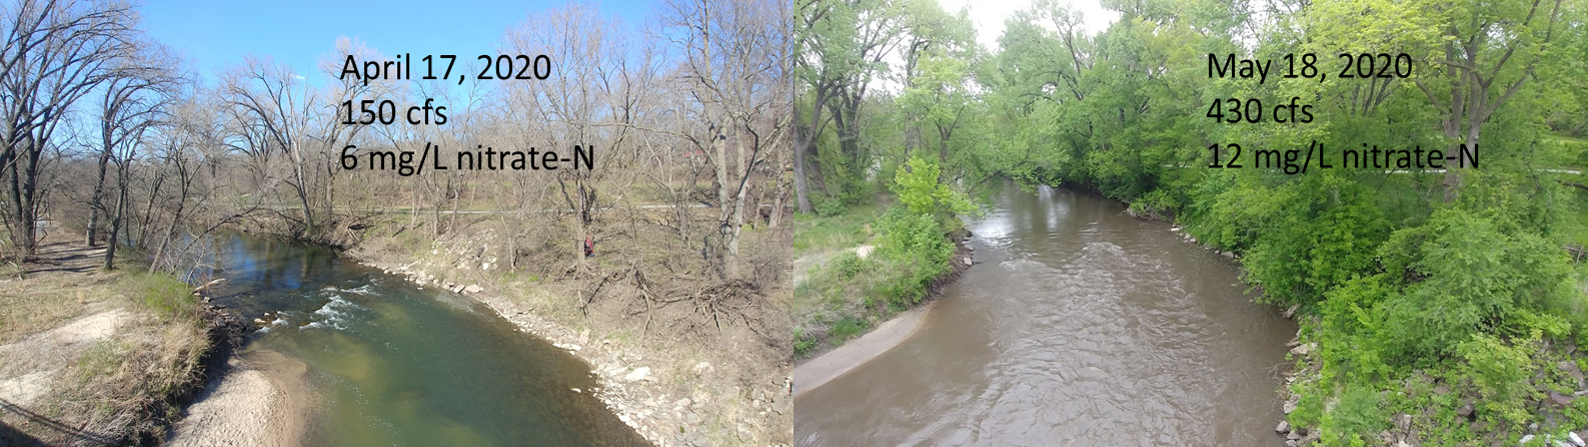
Last weekend’s rains (5-17-2020) provide a clear illustration of how water and nitrate make their way to Squaw Creek.
Squaw Creek at Brookside Park
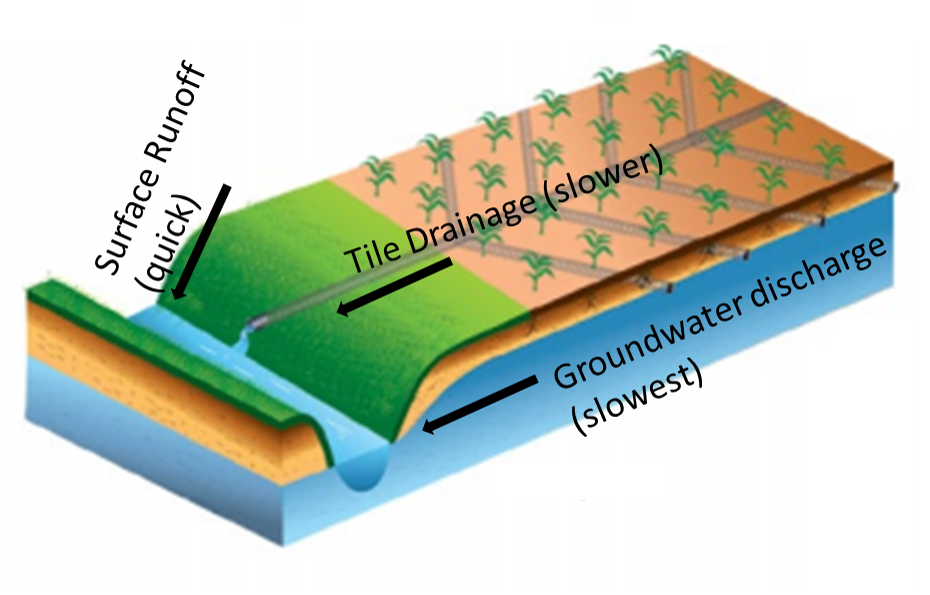
How water reaches Squaw Creek after a rain
It started raining late Saturday night and stopped around 3AM Sunday. The rain gage outside my house in Ames showed 0.9 inches. The water hitting my driveway and other paved surfaces in my neighborhood enters a storm sewer that goes directly to a tributary of Squaw Creek. (In newer neighborhoods, the water would be slowed down by a pond or detention basin). This runoff takes about an hour to make its way down Squaw Creek to the USGS stream gage at Lincoln Way. In response to urban runoff and the rain that fell directly on the channel, we can see a quick rise in the water level, and quick fall.
Over the next 15 hours, Squaw Creek rose another foot as it was joined by water that fell as far away as Stratford and Stanhope. Other than urban areas, we probably didn’t see much runoff from the storm, which was relatively gentle and fell on soils that weren’t particularly steep or waterlogged. The fall in water level Sunday afternoon and Monday was more gradual, reflecting the release of water from drain tiles and groundwater.
Figure adapted from University of Michigan Extension
How nitrate reaches Squaw Creek after a rain
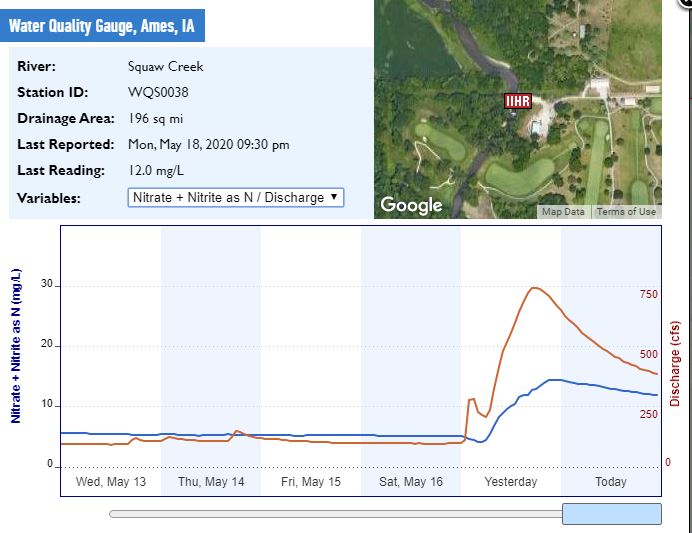
It’s well-known that tiles and ditches provide a direct pathway for nitrogen to leak out of the soil in corn and soybean fields. Think of cover crops as a way to plug the leak, and bioreactors, saturated buffers, and wetlands as a bucket placed underneath. You can watch the leak from last weeks’ storm with IIHR’s nitrate sensors. This graph is from a sensor installed in Squaw Creek in Moore Park, where it enters Ames. (The colors are the reverse of what you’d expect–brown is streamflow, blue is nitrate).
The nitrate concentration in Squaw Creek fell from 5 to 4 mg/L overnight, diluted by direct precipitation and urban runoff, and then rose to 14 mg/L as water from drainage tiles made its way downstream. As tile flow tapers off, nitrate concentrations gradually fall toward the lower levels seen in groundwater.
Nitrate drops as you move downstream
In Hardin County, there’s a nice set of three sensors that clearly showed what happens as water moves downstream during this storm. Not every stream demonstrates this behavior, but many do.
At the tile outlet, nitrate levels are highest to begin with (10.9 mg/L) and show the sharpest increase, spiking to 18.3 mg/L by 5AM after some initial dilution. Since the water takes some time to reach the next downstream sensor, Tipton Creek near Hubbard, the peak doesn’t happen until 8 PM, rising from 8.6 mg/L to 17.1 mg/L. Further downstream in the South Fork of the Iowa River, near New Providence, water is reaching the sensor from several tributaries, smoothing out some of the changes. Nitrate rises from 4.5 mg/L Saturday night to a peak of 16.2 on Monday morning at 11:00.
There are several reasons why nitrate tends to decline as you move downstream. First, tile systems drain mostly agricultural land, while a larger stream will also drain some field margins, pasture, and woodland. Second, nitrate is removed from the water by algae, plants, and microbes. Waterlogged organic matter, whether in a low spot in a field, a wetland, a stream bottom, or a woodchip bioreactor, is good habitat for denitrifying bacteria. Third, many Iowa streams flow from northern Iowa southeast to the Mississippi River, or southwest to the Missouri River, and as you get into southern Iowa, the land becomes hillier, tile drainage becomes less frequent, and pasture more common.
Tile drained fields lose a lot of nitrogen in spring. That’s not news to anyone, but hopefully this helps you visualize and understand the process.
Update, 5/29/2020: We had even bigger rains the following week, but spread over several days, so the pattern was less clear. We’re still seeing nitrate concentrations >10 mg/L in the rivers, and >15 mg/L at tile outlets.
The Iowa Department of Natural Resources is seeking public comment on the newly released draft impaired waters list. Prairie Rivers of Iowa will be recommending that Squaw Creek and East Indian Creek be added to “Waters in Need of Further Investigation.” We’ll also take this opportunity to try to demystify a topic that can be confusing, using examples from the South Skunk River watershed.
Every two years, the DNR is required to assess the available data to determine whether Iowa’s lakes, rivers, and wetlands are meeting their designated uses. About half the rivers, and a bit more of the lakes have enough data to assess. Since new waters are considered each cycle, the length of the impaired waters list doesn’t really tell us whether water quality is getting worse. Since nutrients aren’t considered for most uses and the data used for the 2018 assessment is from 2014-2016, it doesn’t tell us whether the Iowa Nutrient Reduction Strategy is working. What it tells us is the extent and severity of local water quality problems that have been officially vetted.
Recreational Uses
A river segment, lake, or reservoir that gets use by paddlers or where children play would be designated A1 (primary contact recreation use) or A3 (children’s recreational use). To determine whether the water quality is good enough to support these uses, the DNR compares E. coli bacteria to the state standard (a geometric mean of 126 organisms per 100mL). If the stream consistently exceeds the standard, that means there could be enough human or animal waste in the water to pose a health risk to anyone that swallowed some–a child splashing in the creek, or a paddler who tipped their canoe might get exposed to a waterborne illness.
Fully supporting: None of the lakes or rivers in our watershed appeared on this list
Partially supporting: The South Skunk River above Ames was slightly impaired with high E. coli levels in one of three years. Indian Creek near Maxwell, the upper part of Long Dick Creek in Hamilton County, Montgomery Creek in Boone County, Hickory Grove Lake in Story County, Lake Keomah and White Oak Lake in Mahaska County all have moderate E. coli problems.
Not supporting:Prairie Creek in Boone County has consistently high E. coli levels. The data was collected through an agreement between Iowa DNR and volunteers with the Squaw Creek Watershed Coalition.
Not assessed: This includes Squaw Creek, East Indian Creek, McFarland Pond, and many others.
Wait a minute, Squaw Creek and East Indian Creek? Didn’t we work with City of Ames and Story County Conservation to collect three years of monthly E. coli samples, starting during the assessment period? Wasn’t the 2016 geometric mean ten times higher than the standard? Yes, but DNR never approved a quality assurance plan, so under Iowa’s Credible Data Law, they can’t use our data. However, we will write to DNR to recommend that they add those streams to Iowa’s list of waters in need of further investigation (WINOFI). We’re aware that bacteria cleanup plans for large rivers are difficult to do and are a low priority for the department, but we want people to be more aware of the health risks.
Aquatic Life Uses
The South Skunk River is a warm water stream with a smallmouth bass fishery, so is designated B(WW-1). Most of its perennial tributaries don’t have enough water or habitat for gamefish so are designated* B(WW-2) for other aquatic life. Fish kill reports, biological monitoring of fish and invertebrates, and monitoring of dissolved oxygen and some toxic chemicals are used to assess whether water quality is good enough to support these uses.
*Adding to the confusion, smaller creeks are given a presumptive A1 B(WW-1) designation until a Use Attainability Assessment proves otherwise. This change supposedly gives them extra protection, but I don’t see how that would work in practice.
Waters in Need of Further Investigation:Onion Creek, Worrell Creek, and College Creek had some low scores for fish or invertebrates, but DNR hasn’t worked out an appropriate threshold for these headwater creeks. The lower part of Ballard Creek was removed from the impaired waters list and placed in this category when DNR discovered an error in the previous assessment.
Not Assessed: This includes several segments of the South Skunk River, Dye Creek, Clear Creek, Keigley Branch, West Indian Creek and many others.
Takeway message:
If a river was added to the impaired waters list, don’t assume it’s gotten dirtier. Maybe it was always polluted and we hadn’t bothered to look. And by the same token, if a river is not on the impaired waters list, don’t assume it’s clean.
GIS mapping is a big part of my job, but I’ll be the first to admit there’s a limit to what you can learn about a stream without getting your feet wet, or at least dipping a bucket into the water.
I’ve been testing West Indian Creek and Grant Creek at the lovely Jennett Heritage Area, just above their confluence. (With some help from David Stein and Rick Dietz) West Indian Creek flows through Nevada and drains 28,417 acres at this point. Grant Creek, also known as Drainage Ditch 5, drains 13,344 acres between Ames and Nevada.
Based on soils and landcover in the watershed, I’d expect Grant Creek to have comparable or slightly worse water quality than West Indian Creek. There are nutrient loading models available online and in the Story County Watershed Assessment that predict just that.
Instead, I’ve found that water quality is consistently better in Grant Creek. West Indian Creek has normal nitrate levels but very high phosphorus levels. At this point, I don’t know why.
Orthophosphate (mg/L)
Grant Creek
W. Indian Creek
5/14/2019
0
0.6
6/11/2019
0.1
1.0
7/25/2019
0
3.0
9/10/2019 (after rain)
0.6
4.0
Nitrate (mg/L)
Grant Creek
W. Indian Creek
5/14/2019
2
5
6/11/2019
2
5
7/25/2019
2
5
9/10/2019 (after rain)
0
0
I do know there are people in the West Indian Creek watershed working to improve water quality, both on private land and public land. If you own land or farm in the watershed and are thinking about doing more to conserve soil and water, contact our Watershed Coordinator, David Stein, to set up a free consultation.
If you live near Nevada and are want to help solve the mystery of these two creeks through water testing, contact Dan Haug. Prairie Rivers of Iowa is working with Story County Conservation and the Izaak Walton League to plan for and support volunteer stream monitoring around Story County in 2020.
A final note: Don’t judge a stream by its name, or lack of a name. The lower part of Drainage Ditch 5 is a natural creek with buffer vegetation, fish, clean water, and public access. The map below shows a pre-settlement land survey superimposed over a current topographic map. Interestingly, West Indian Creek was forested while Grant Creek was prairie. Thanks to the restoration efforts of Cindy Hildebrand and Roger Maddux, parts of Grant Creek are prairie once again.
This post is part of a series for 2019 Watershed Awareness Month, comparing water quality in a pair of local creeks to learn how land and people influence water.
On May 20, the Skunk River Paddlers launched their canoes and kayaks on Squaw Creek at 100th Street in Hamilton County and paddled down to 140th St in Boone County. The recent rains made it a fast ride!
However, the rain also washed a lot of sediment and quite likely some land-applied manure into the stream. I collected a water sample just before I took this photo and had a lab test it for E. coli bacteria, an indicator of fecal contamination: 2,390 CFU (Colony Forming Units)/100mL. That’s 10 times the primary contact standard for a single sample (235 CFU/100mL) and just shy of the secondary contact standard (2880 CFU/100mL).
Later that day, I collected a sample from Brookside Park in Ames with the help of my son. The lab results came back at 12,800 CFU/100mL, well above the secondary contact standard!
I don’t want to discourage people from recreating in Squaw Creek but I think a safety reminder is necessary:
Squaw Creek has consistent fecal contamination that could pose a risk of acquiring a waterborne illness. The risk is higher after heavy rains when the water is muddy—consider wearing waterproof boots when wading under these conditions. If you come into contact with the water, wash your hands or apply hand sanitizer before eating and take precautions to avoid getting river water in your mouth or on an open cut.
The numbers above are high, but not unprecedented. Over the past three years, City of Ames staff have been tracking E. coli, nitrogen, and phosphorus in Squaw Creek at Lincoln Way and we’ve been sharing the data on our website. 46 out of 48 samples exceeded the primary contact standard for E. coli!
Yes. Yes there is.
The pattern is also not unusual. In our Snapshots, we see that Squaw Creek usually exceeds the standard by the time it reaches Ames and picks up additional fecal contamination by the time it reaches Duff Ave.
The Ames City Council, Public Works Department, and Water & Pollution Control Department are concerned by the data and committed to helping find and address sources of contamination within city limits. The City of Ames spends $3.5 million a year repairing and upgrading its sanitary sewers. However, the data point to multiple sources of E. coli that will make this a difficult problem to solve. In addition to sewer leaks, we probably have some failing septic systems in the upper watershed, cattle in the stream, land-applied manure carried by runoff, pet waste, and wildlife. E. coli can also persist for a while in the sediment, and gets stirred up again after a rain.
In June, I went back to Brookside Park to demonstrate some water quality testing for kids enrolled in the Community Academy summer program. In addition to exploring nature and food systems, the kids have been hard at work improving removing invasive species, planting pollinator gardens, improving trails, and coming up with interpretive signs for Brookside Park. I’m pleased to see that one of the signs is about water quality, including a reminder to wash your hands after entering the creek, and tips on how to reduce pollution. Look for the signs to go up later this summer.
My son Leif shares a draft of a water quality sign at the Community Academy’s open house