Water quality in the South Skunk River is still poor but has gotten better in the last five years. One reason for improvement is a new disinfection system at the Ames wastewater treatment plant.
Dr. Chris Jones recently shared a water quality index he developed for Iowa rivers, combining five important water quality metrics. Of the 45 sites in the Iowa DNR’s ambient monitoring network, the South Skunk River near Cambridge scored “poor” and ranked 34th overall. This site also has the 3rd highest phosphorus and the 5th highest E. coli levels.
A follow-up article looked whether the current (2016-2020) water quality index has changed from previous decades. Most rivers have stayed the same or gotten worse, but the South Skunk had a better score. Three of the metrics (total phosphorus, total nitrogen, and E. coli bacteria) improved, while one (turbidity, a measure of sediment in the water) got worse.
Phosphorus and muddy water usually go together, so this odd pattern demanded some explanation. I did my own analysis of the data, curious if the changes were happening under drier conditions (when wastewater has a bigger influence), wetter conditions (when agricultural runoff has a bigger influence) or both.
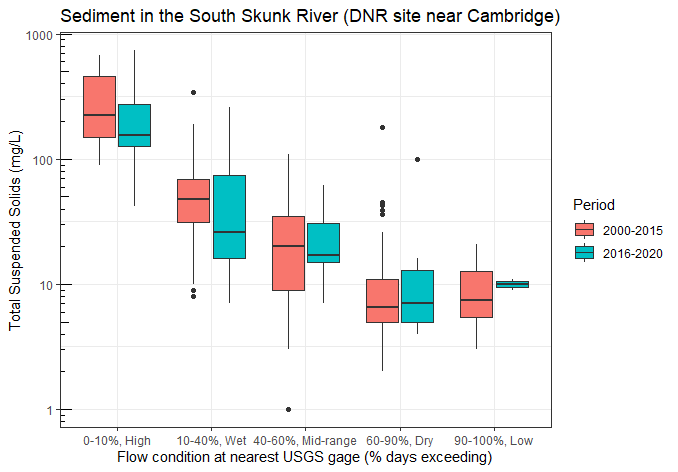
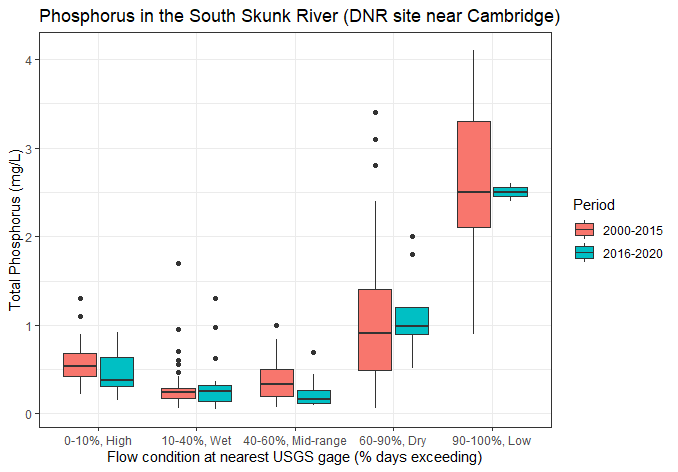
See last week’s post for an explanation of the flow categories I’m using. I use a lot of boxplots, which show both the central tendency and the spread of the data. The lower end, middle, and upper ends of the box are the 25th, 50th (median) and 75th percentiles. The “whiskers” show the maximum and minimum, unless they’re really far out there, in which case the “outliers” represented by dots. Water quality data never fits a bell curve, so lopsided boxes and outliers are to be expected.
It turns out that the river didn’t get any muddier (it got less muddy) when you compare wet conditions to wet conditions and mid-range conditions to mid-range conditions.
It’s just that the past five years were a little wetter and so a larger share (43% vs 29%) of the samples were collected during wet conditions when the river was moving swiftly and carrying more sediment. A smaller share (25% vs 42%) of the samples were collected during dry and low-flow conditions when the water is usually clear. That made the average sediment concentration increase.
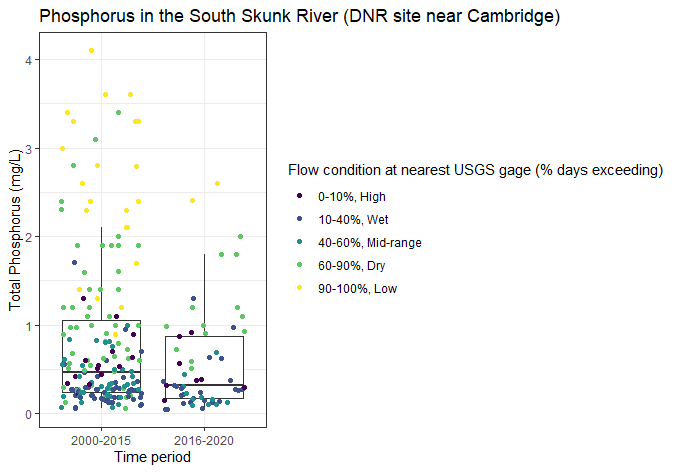
Weather also can explain trends in phosphorus. In the past five years, a smaller share of the samples were collected during dry and low-flow conditions when phosphorus concentrations are especially high. That made the average phosphorus concentration decrease.
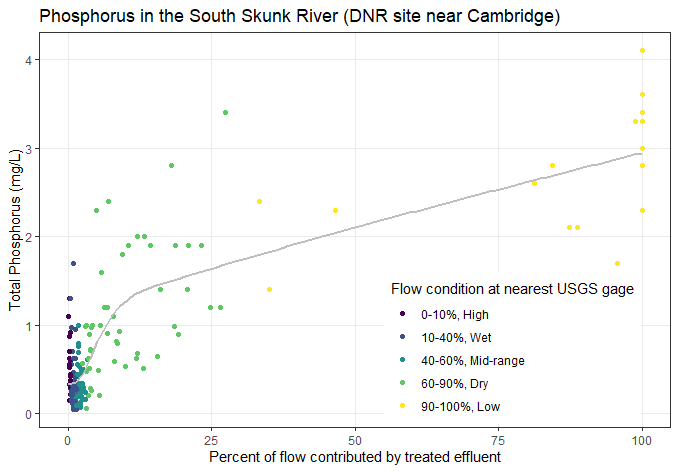
Why is phosphorus so high when it’s dry? The monitoring site in question is just below the outfall of Ames Water Pollution Control Facility on 280th St, about 4 miles north of Cambridge. This facility discharges over 6 million gallons a day of treated wastewater. When conditions are dry, the effluent is less diluted, and so phosphorus in the stream approaches phosphorus levels in the effluent (which averages 3.8 mg/L), as shown in the graph below. This year we’ve also monitored West Indian Creek below the Nevada wastewater treatment plant and have seen the same pattern.
Wastewater treatment plants are regulated to minimize the impact on receiving waters and the Ames WPC Facility has one of the best compliance records in the nation. However, while the treatment process is very good at removing ammonia, solids, and oxygen-depleting substances, the process is not that effective for removing nutrients.
The Iowa Nutrient Reduction Strategy is not voluntary for wastewater treatment plants. The Ames Water and Pollution Control Department commissioned a feasibility study as a condition of its permit, which determined that the facility could achieve a 67% reduction in total nitrogen and a 75% reduction in total phosphorus by replacing its trickling filters with an activated sludge treatment system. This new system will be phased in as the filters reach the end of their useful life (starting in 2027) and will cost $39.6 million.
In the last five years we have not seen any reduction in phosphorus during dry and low-flow conditions when wastewater treatment systems have the biggest influence. However, there was a reduction in phosphorus* under mid-range and high flow conditions! This is really interesting–I’ll have to look at some other data sets to see whether it holds up and whether we can link it to conservation practices in the watershed.
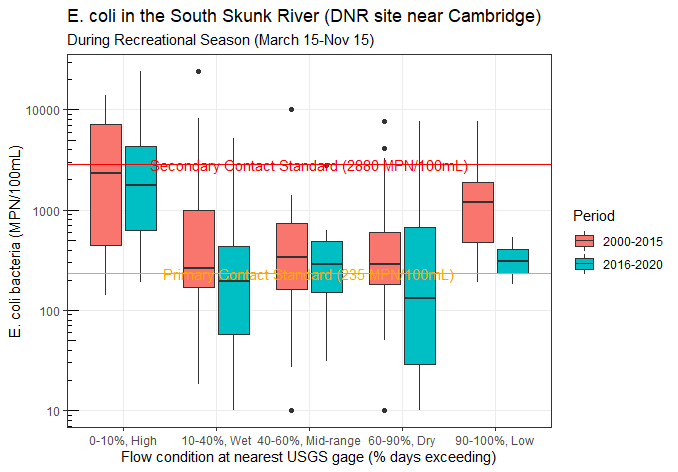
For E. coli, we see improvement across all conditions, with the largest improvement during low-flow conditions* when wastewater has the biggest influence.
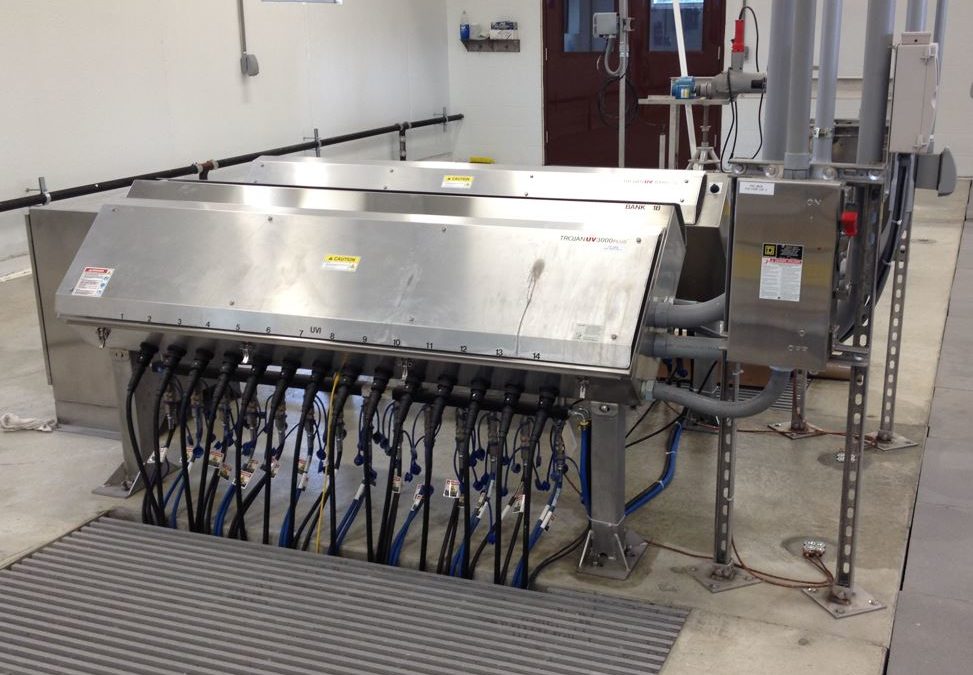
The effluent discharged to the river has gotten a lot cleaner since the Ames Water Pollution Control Facility built $2 million disinfection system using ultra-violet (UV) light. The system was completed in March of 2015. During the recreational season (March 15-Nov 15), treated effluent passes through two banks of lights that kill microbes. Prior to this, some E. coli and pathogens could make it through the system and end up in the river. Chlorination, a good solution for disinfecting drinking water and swimming pools, is not ideal for wastewater because it can harm fish.
Kris Evans, an environmental engineer for the City of Ames and the project manager, said this about the system:
“By using UV we continue to be “chemical free” for treatment of the wastewater and it’s much safer for staff since they don’t have to chlorinate and dechlorinate. When flow is low at the plant, we are able to lower the intensity of the bulbs to save energy and still meet permit limits; as flow increases so does the UV light intensity. The City started design of the UV system before it was mandated in a permit; we knew it was coming, but wanted to be proactive in the treatment of water, making it safer for those who recreated in the river. It was also the first project the department funded through an State Revolving Fund (SRF) loan.”
We still see high E. coli levels in other streams that receive effluent, but smaller wastewater treatment systems are also making the switch to comply with new permit requirements. In Story County, Gilbert added a UV disinfection system in 2019, the Squaw Valley HOA completed theirs in 2020, and Nevada will build a new wastewater treatment plant in 2022 that includes UV disinfection.
* I’ve written before about the challenges of detecting water quality trends. I’m pleased to report that two of the trends discussed here (a reduction in phosphorus at mid-range flow conditions, and a reduction in E. coli in dry and low-flow conditions) were statistically significant at 90% confidence level, using a test of the difference between medians. The approach employed here (sorting by flow conditions) may be a good way to control for weather and reach more reliable conclusions. It’s exciting to have some good news that holds up to further analysis!
During a long period of dry weather like we’ve been having, some rivers are cleaner than usual, some are just as dirty. It depends on which pollutants we’re talking about, and where they’re coming from. Understanding which is which can help us diagnose problems and prioritize solutions.
The South Skunk River upstream of Ioway Creek is at its cleanest (clear and with low E. coli) when the weather has been been dry. If you’re going to let your kids splash in the water, go here.
Ioway Creek is less muddy but not any cleaner (high E. coli levels) when the weather has been dry and water levels are low. Lots of algae this summer, too.
For example, if a stream has high E. coli levels when water levels are low, that’s probably not because of manure carried in agricultural runoff… because when the soils are this dry, what little rain we get soaks in and doesn’t run off. Under dry conditions, more likely sources are things like cows in the stream or a septic system illegally hooked up to a drainage tile(yes, we’ve seen this happen). We’ll discuss wastewater treatment plants next time.
The figure below, from the cleanup plan (TMDL) for the Iowa River basin, matches E. coli sources to flow conditions. These kind of graphs take some explanation, but it’s a really helpful framework for making sense of water quality data.
The categories on the x-axis are based on percentiles. “High flows” are the top 10% of daily average flows in a given record. Looking at the last 20 years of data from the USGS gage on the W. Riverside Rd. in Ames (Sleepy Hollow Access), that corresponds to at least 5,453 cubic feet per second of water–probably too fast for safe paddling. “Dry conditions” are the 90th to 60th percentile, corresponding to between 10 and 70 cfs of water–definitely not enough water for paddling.
When graphing stream flow or E. coli, we often use a logarithmic scale, where each major tick mark is a ten-fold increase. Since flow can range from 0 to 10,000 cfs in a river like the South Skunk, it’s the only way you can read it.
Boxplots are helpful for seeing summarizing the data. The bottom, middle line, and top of the box represent the 25th, 50th, and 75th percentiles.
In the upper stretch of the South Skunk River, measured at Sleepy Hollow Access, if you take your canoe out during mid-range conditions, it’s more likely than not that E. coli will meet the primary contact recreation standard (the center line on the box, the median, is below the orange line). It’s even cleaner in dry conditions. Paddlers would benefit from attention to E. coli sources that show up under “wet conditions” such as manure carried in agricultural runoff.
In Ioway Creek at Lincoln Way, E. coli is likely to exceed the secondary contact standard under mid-range conditions, and it’s usually exceeds the primary contact standard across all conditions. Kids play in this creek, and they would benefit from some attention to sources of bacteria that show up under “dry conditions”: this could include inspecting septic systems and working with cattle producers to fence cows out of streams.
“If it never rained, we’d have great water quality in Iowa.”
-Jim Richardson
“If it never rained, we’d have great water quality in Iowa,” joked a volunteer at our May 15 water quality snapshot. 15 of us spent the morning testing Ioway Creek and its tributaries in Boone, Hamilton, and Story County and were marveling at the low nitrate levels and crystal clear water at the majority of our sites.
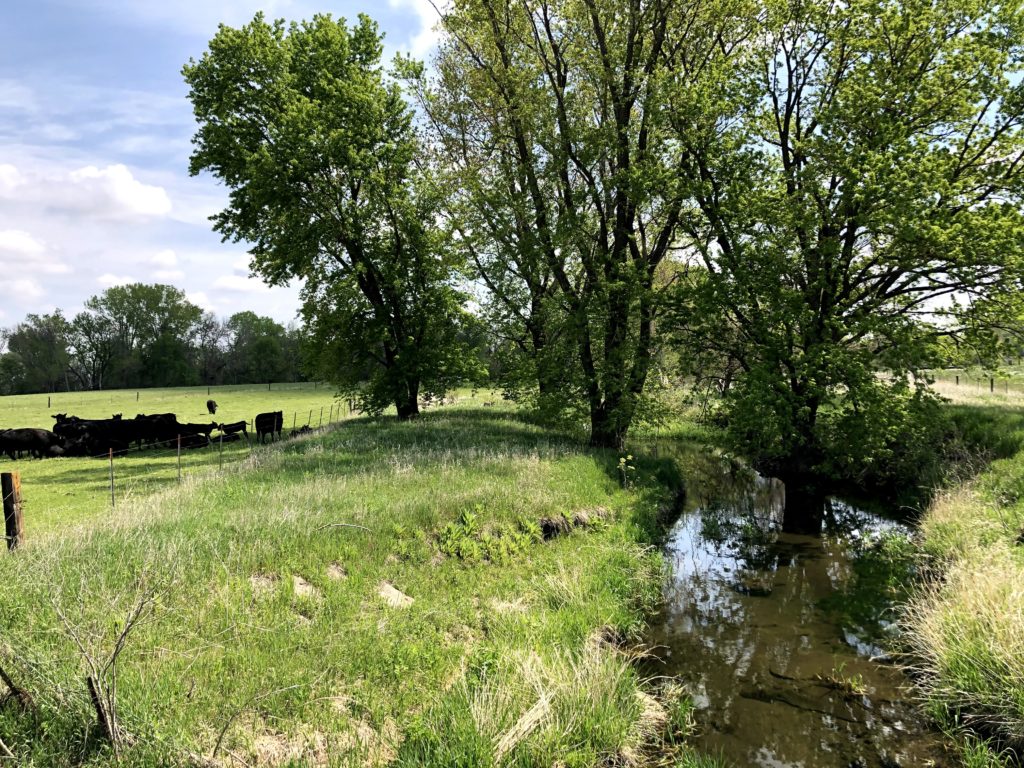
I wish more creeks in central Iowa were like this spot in Boone County. Cows fenced out the creek, a CREP wetland upstream keeping nitrate levels low, orioles and a kingfisher flitting between the trees.
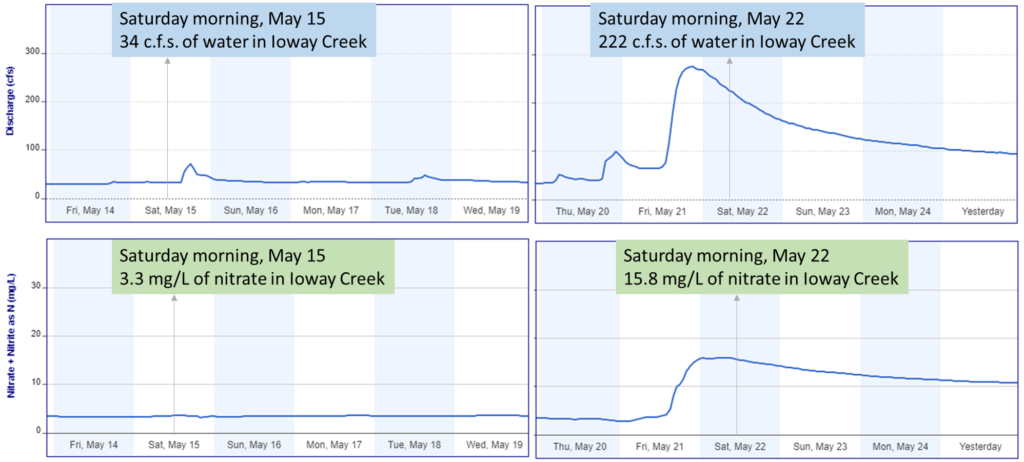
Well, we’ve had some much-needed rain in the week since, and water quality has gone from good to bad. I’ve written before about “weather whiplash” that explains some of the big swings in nitrate over the past decade and here’s an early hint of it. Here’s data from a nitrate sensor in Ioway Creek installed by IIHR-Hydroscience and Engineering. A five-fold increase in nitrate concentrations in just one week! The water has gone back down but the nitrate levels are still above the drinking water standard.
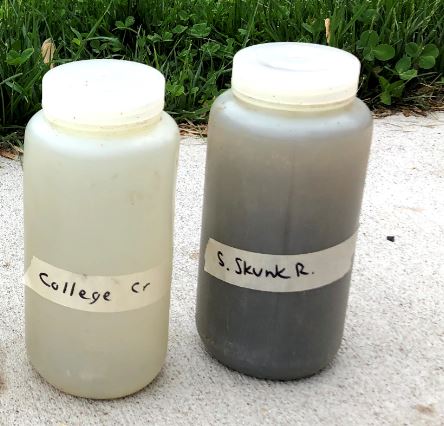
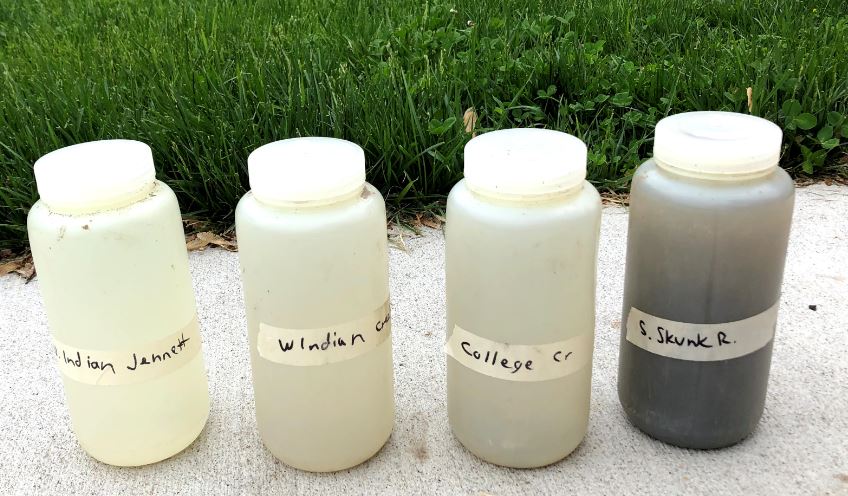
And here’s some water samples I collected on Friday May 21. No, that’s not my coffee thermos, that’s some of the world’s best top soil washing down the Skunk River!
Four samples collected May 21, after a 3/4 inch rain
That’s not to blame the weather. It does rain in Iowa and if your farming practices let a plume of topsoil, manure, or fertilizer wash off the field every time that happens, you’re doing it wrong! Some farmers are doing it right (I saw some cover crops this spring near Nevada and lots driving on I-80) but not enough, especially in the Ioway and South Skunk River watersheds.
Water quality monitoring has been top of mind for Prairie Rivers of Iowa lately and I see an challenge and an opportunity. It’s a challenge to interpret data and track our progress when one good rain can cause water quality to go from clear to coffee-colored overnight! There’s an opportunity to be more strategic about how and where we test, so we notice and communicate more eye-opening moments like this one, and hopefully persuade a few more people to protect soil and water.
Update: June has been abnormally dry and Hamilton, Boone and Story County are experience severe drought. Droughts stress is impacting crops and smaller streams are drying up.
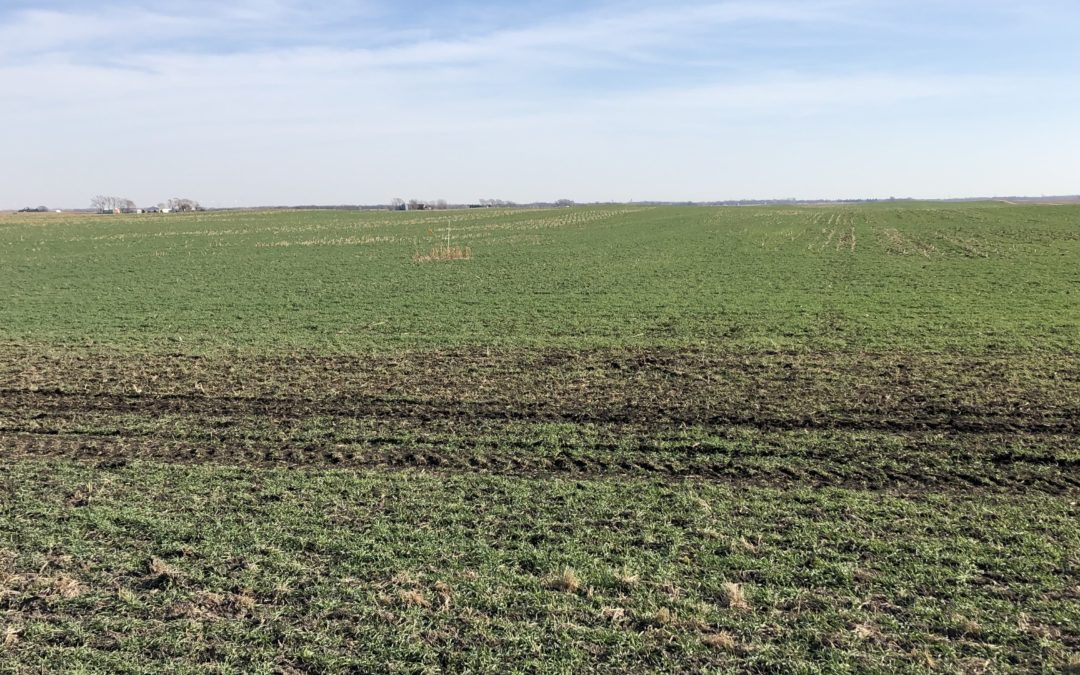
Nice looking rye cover crop near Nevada, IA November 2020
A big thank you to farmers who planted cover crops after this challenging year. Cover crops will hold soil and nutrients in place through the winter and early spring. That could be especially important this year.
After a drought, nitrogen that might normally have been taken up by a high-yielding crop or flushed away by rainfall remains in the soil. That leftover nitrogen could be available for next year’s crop, but only if:
A) we have a dry spring, or
B) farmers have made use of practices like cover crops or nitrification inhibitors that prevent nitrogen losses during the fallow season.
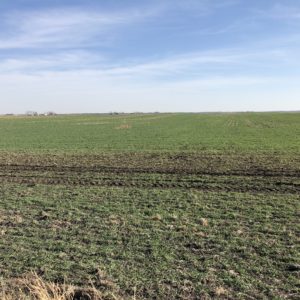
A wet year in 2013 following a dry year in 2012 (dark blue) caused nitrate concentrations in many central iowa streams to jump as much as 10 mg/L higher than usual (red). Figure from Van Metre et al. 2008
A drought in 2012 following by a wet spring in 2013 led to nitrate concentrations in excess of 20 mg/L in many rivers in Central Iowa. If we have a wet spring in 2021, we could see this happen again. As one scientific paper put it, “weather whiplash drives deterioration of water quality.”
“Weather whiplash” can also help explain the long-term trends I’ve been seeing in the South Skunk River and its tributaries: a decline in nitrate concentrations from 2005-2012, a big jump in 2013, and another decline over the past 7 years. I’ll walk you through my analysis.
Explaining nitrate concentrations in the South Skunk River
Technical details, feel free to skip: This data was collected by the City of Ames just upstream of wastewater treatment plant. The City has monitored the South Skunk River above and below its wastewater treatment plant almost every week since 2003! Flow is measured continuously at a few miles upstream USGS gage near S. 16th St. I’ve summarized nitrate concentrations and streamflow by season (Jan-Mar, Apr-Jun, Jul-Sep, Oct-Dec). At each step of the way, I apply a linear regression equation and graph the model residuals. Taken together, these three factors explain 59% of the variation. The effects of “weather whiplash” may extend beyond one year, since nitrate from some parts of the field may travel more slowly to streams via groundwater.
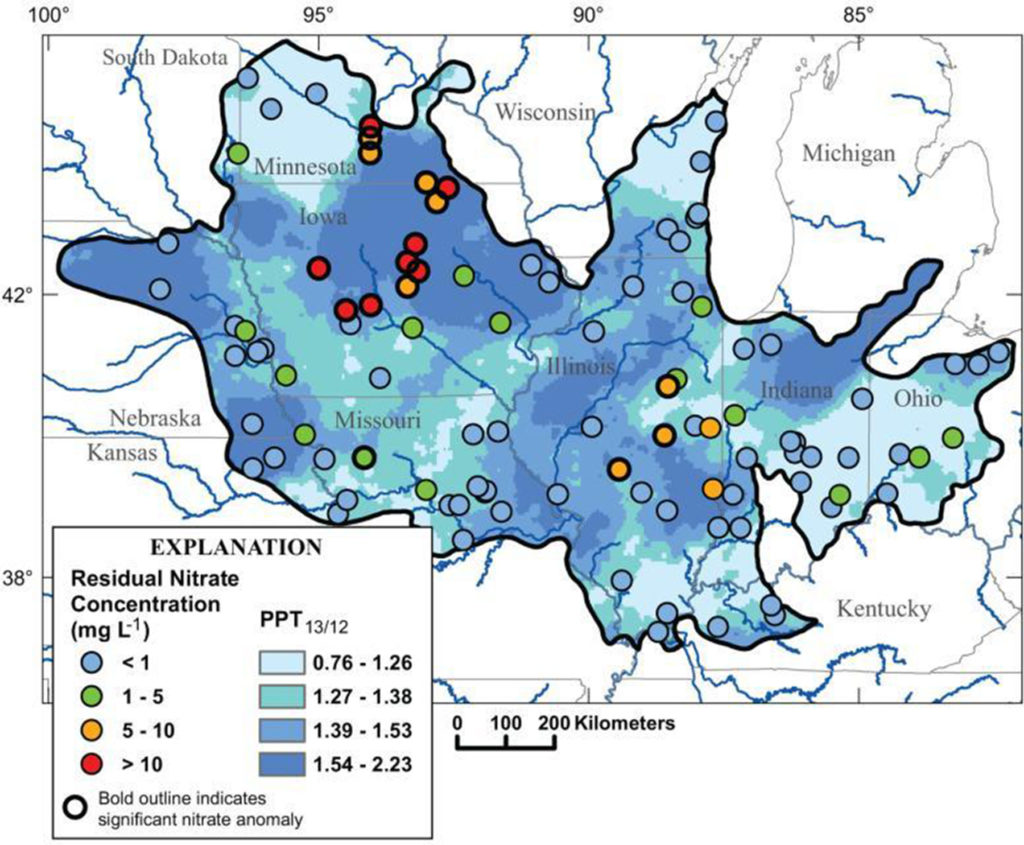
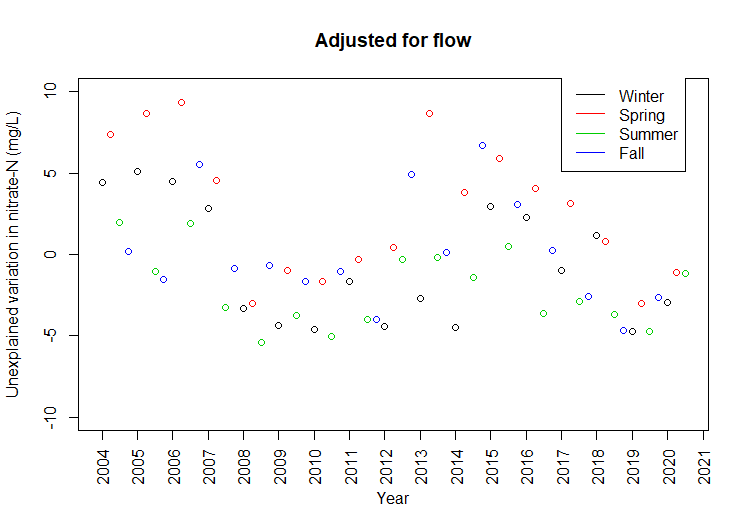
In a given quarter, nitrate concentrations in the South Skunk can be up to 10 mg/L higher than the long-term average, or as much as 10 mg/L lower. The following graphs show how much variation is left to explain after correcting for current weather, last year’s weather, and season.
Nitrate in the South Skunk is again declining after a sudden increase in 2013.Low-flow conditions in 2011-2013 explain unusually low nitrate concentrations.
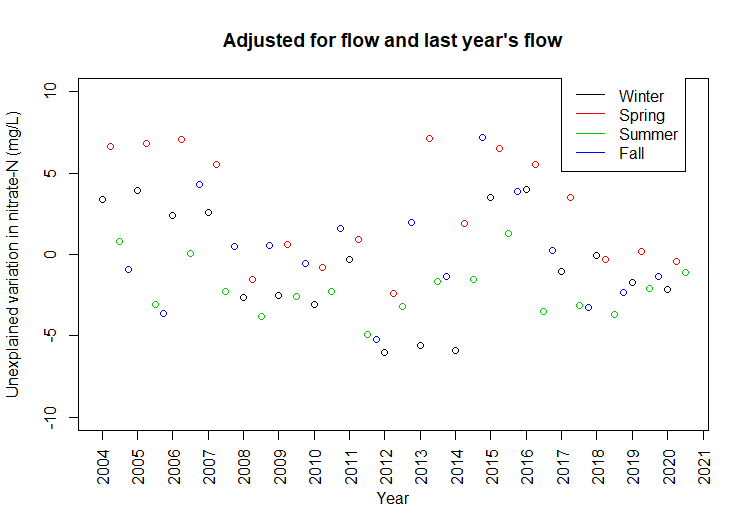
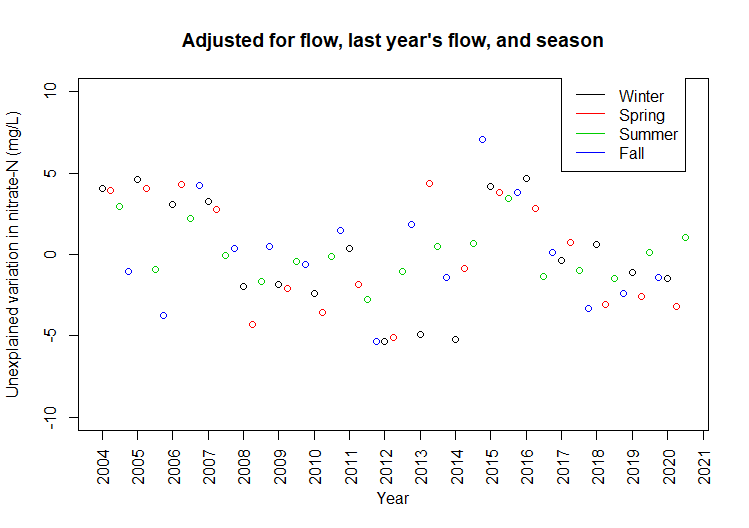
Wet springs following dry years explain unusually high nitrate concentrations.Seasonal patterns explain some of the remaining variation.
The lowest nitrate concentrations can be explained by streamflow: when the weather is dry and tiles aren’t flowing, nitrate levels in rivers taper off to the background levels seen in groundwater.
The highest nitrate concentrations can be explained by weather over the previous 12 months: a wet period following a dry period will flush out nitrate that’s accumulated in the soil.
After that, there’s still a seasonal pattern independent of rainfall: nitrogen is most susceptible to loss in spring when soils are bare and microbial activity picks up (April-June) and least susceptible when the maturing crop is using up the available nitrogen (July-Sept).
Can some of the remaining pattern be explained by greater adoption of conservation practices in the watershed in the past 5 years? We hope so, but let’s see what happens next spring!
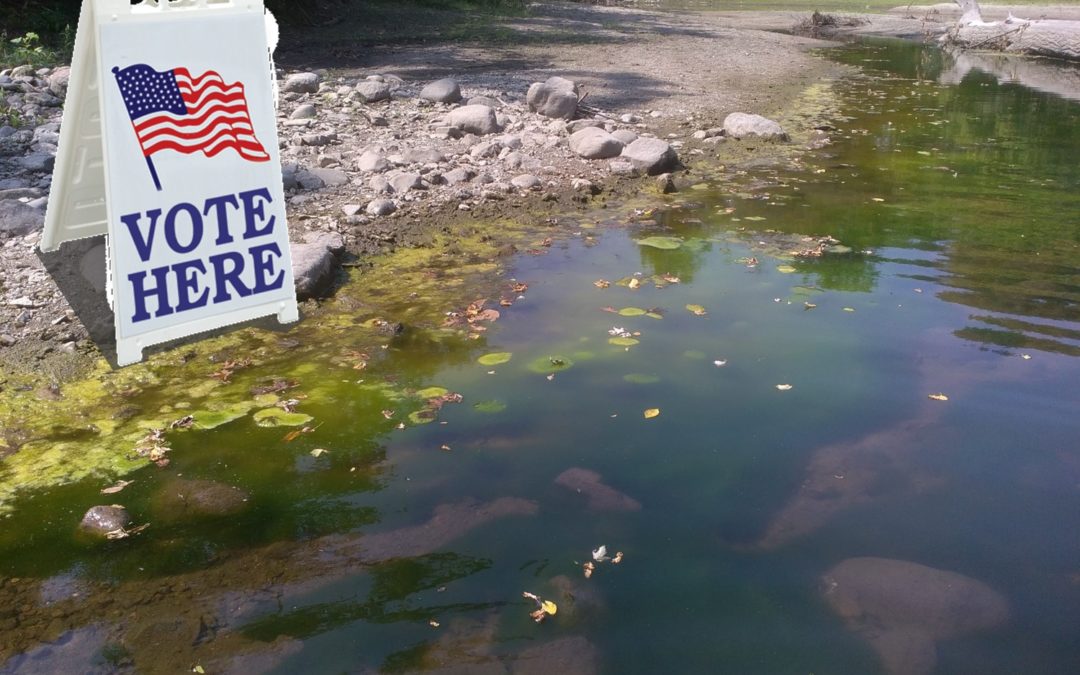
Disclaimer: This article is not about politics. PRI is a non-partisan organization and does not want to get drawn into a discussion about the election. My intent here is to use an example that’s fresh in our minds to illustrate a challenge for progress tracking in water quality.
Polls are not always accurate. If you didn’t know that before November of 2020, you do now.
There are plenty of parallels with water, so if you’re looking to water quality monitoring to tell you whether or not conservation efforts in your watershed or your state are succeeding, read on.
Bottom line: Short-term water quality trends are usually too close to call.
Quinnipiac University can’t talk to every eligible voter in Florida, so they surveyed 1,657 people the week before the election.
Similarly, it’s not practical to test water quality in a stream 365 days a year, so we often make do with just 12 days a year. There are sensors that can test nitrate or turbidity continuously during the ice-free months, but they’re not cheap.
The voting patterns of those 1,657 people won’t be perfectly representative of Florida. How close do they expect to be? Based on the sample size, Quinnipiac calculates a margin of error: in this case 2.4 percentage points. Talking to more people would reduce the margin of error, but not enough to be worth the cost. In this case, Biden’s lead appears to be outside the margin of error.
Support for candidate
Point estimate
95% confidence interval
Biden
47%
44.6% to 49.4%
Trump
42%
39.6% to 44.4%
Similarly, the 12 days we test water quality won’t be perfectly representative of the year. How close can we expect to be? We can calculate a margin of error (here, the 95% confidence interval) around our water quality average. Did phosphorus decline in 2019? Too close to call!
Phosphorus in South Skunk River
Point estimate
95% confidence interval
2019 average
0.30 mg/L
0.20 mg/L to 0.40 mg/L
2018 average
0.36 mg/L
0.26 mg/L to 0.46 mg/L
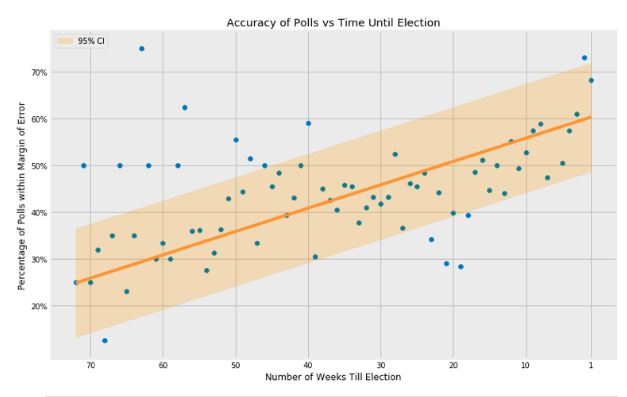
Oops! This poll missed the mark, and by more than the margin of error. Trump actually won Florida with 51.2 percent of the vote. Well, some errors are unavoidable. If sampling error were completely random, we’d expect about 5% of polls to miss by more than the margin of error. That’s what “95% confidence” means. However, according to a new study of 1,400 polls from presidential primaries and general elections, 40% of polls conducted a week before the election missed the mark by that much.
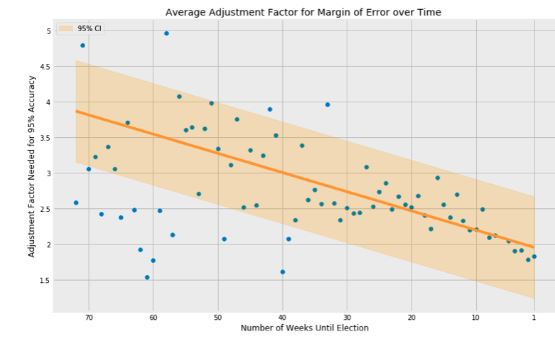
That’s because sampling error isn’t all random. People who ultimately voted one way may have been less likely to appear on the list of phone numbers, less willing to respond, less likely to say what they truly intended, or were more likely to have changed their mind in the final week. And then there’s undecided voters, who don’t always split evenly between candidates. Any of these things can skew the results. Pollsters try to correct for some of these things by weighting various demographic groups, but it doesn’t always work. For “margin of error” to mean what we think it means, according to Kotak and Moore, it would need to be at least two times wider.
Similarly, if monthly samples are not collected on a fixed day of the month, you might underestimate phosphorus or sediment load by planning your week to avoid getting wet, and over-estimate it by going out of your way to capture a sample during a storm. This challenge is well understood in environmental science and there are sampling strategies and equipment to get around it.
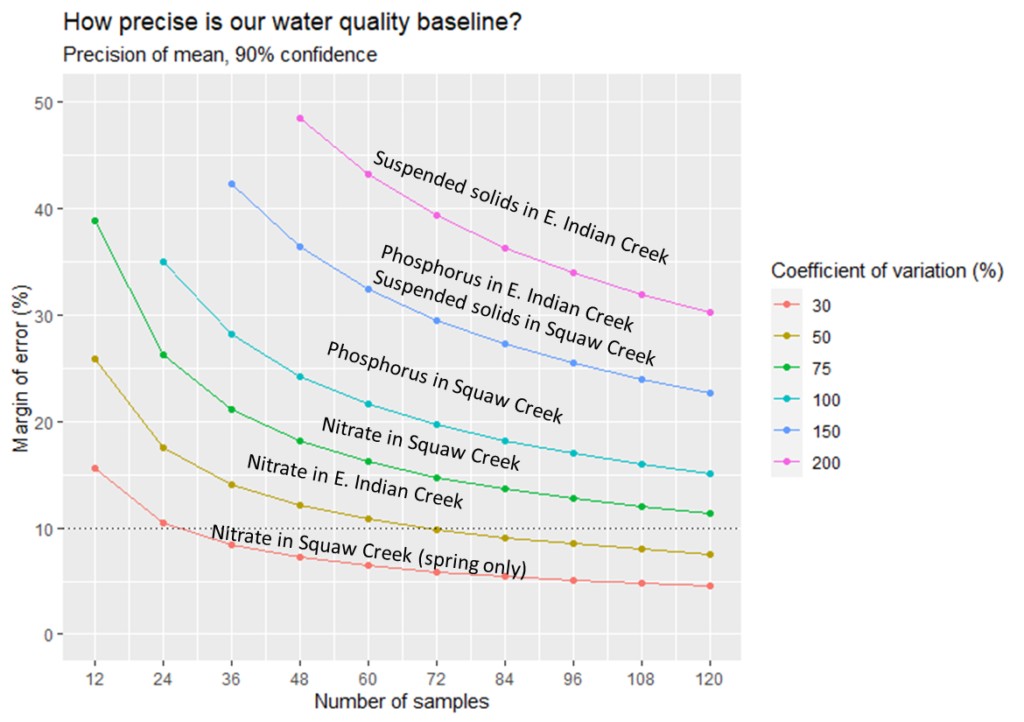
What’s not widely appreciated is just how big purely random sampling errors can be. I’ve read the literature and run my own numbers. Even with a 3 years of sampling, you’re lucky to get below a 20 percent margin of error. The problem is more severe for phosphorus and sediment (which move with runoff and vary a lot within a month) than nitrate (which moves with groundwater and drainage water, and is less variable).
Knowing this can help us set realistic expectations. As much as we’d like to know whether conservation efforts on the land are translating into improvements in water quality in the river, we’re not going to be able to tell the difference between a modest improvement and no improvement unless we sample often enough or long enough to bring down the margin of error. Figuring out whether this is worth doing, how to sustain it, and what other things we can learn from water monitoring has been the task of PRI and our partners around Story County working on a ten-year monitoring plan.
A final note. Have some sympathy for pollsters and scientists who are doing their best to base their findings on data, acknowledge the uncertainty in their conclusions, and strive to be less wrong. There are plenty of people on both sides of the aisle who confidently make predictions based on anecdotes, are wrong more often than not, and never admit it. 😉