There is poop in Iowa’s lakes and rivers! I’m sure you know this by now. The Iowa DNR monitors bacteria at 39 beaches every week during the summer and posts a “swimming not recommended” sign if the average for the month exceeds 126 E. coli/100mL. If a lake has a history of problems, another threshold (235 E. coli/100mL in a single sample) is used as an early warning system. As Iowa Environmental Council has reported, Iowa DNR issued 134 of these beach advisories last summer. Streams are monitored less often, but we can use the same thresholds to evaluate average conditions at the end of the season. Last year, all 15 streams that we monitor in Story County had E. coli levels above the primary contact recreation standard.
Story County Conservation posted a warning sign at the Tedesco Environmental Learning Corridor.
Okay, but what do we do with that information?!
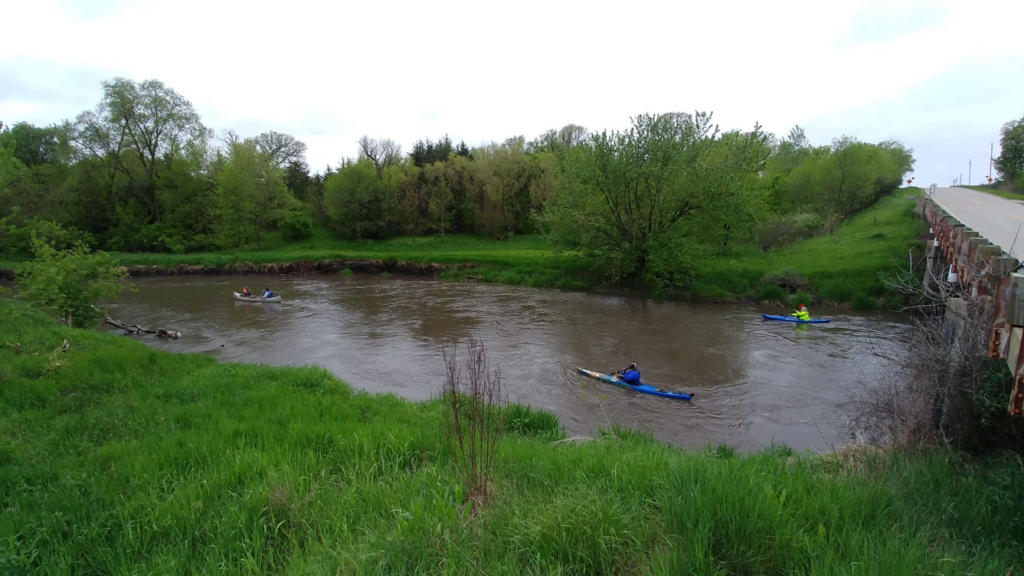
I know some people who are so grossed out they won’t dip their toes in any lake or river in Iowa, even if the DNR says it’s okay. I know some other people who went ahead with a canoe trip on the Des Moines River, despite reports that just two days before, a broken sewer main in Fort Dodge had released 400,000 gallons of raw sewage into the river upstream of their route. They’ve paddled polluted waters before and figured it was no worse than usual.
Part of the difficulty is that some people translate “an unacceptably high number of beach advisories” to “lots of poop in the water everywhere all the time.” That’s not what’s happening. If you picked a summer weekend and a state park at random, and took your family to the beach, you would have had a 77% chance of swimming in water that met the primary contact recreation standard. If you subscribe to IEC’s Water Watch newsletter, you can make sure you pick the right one!
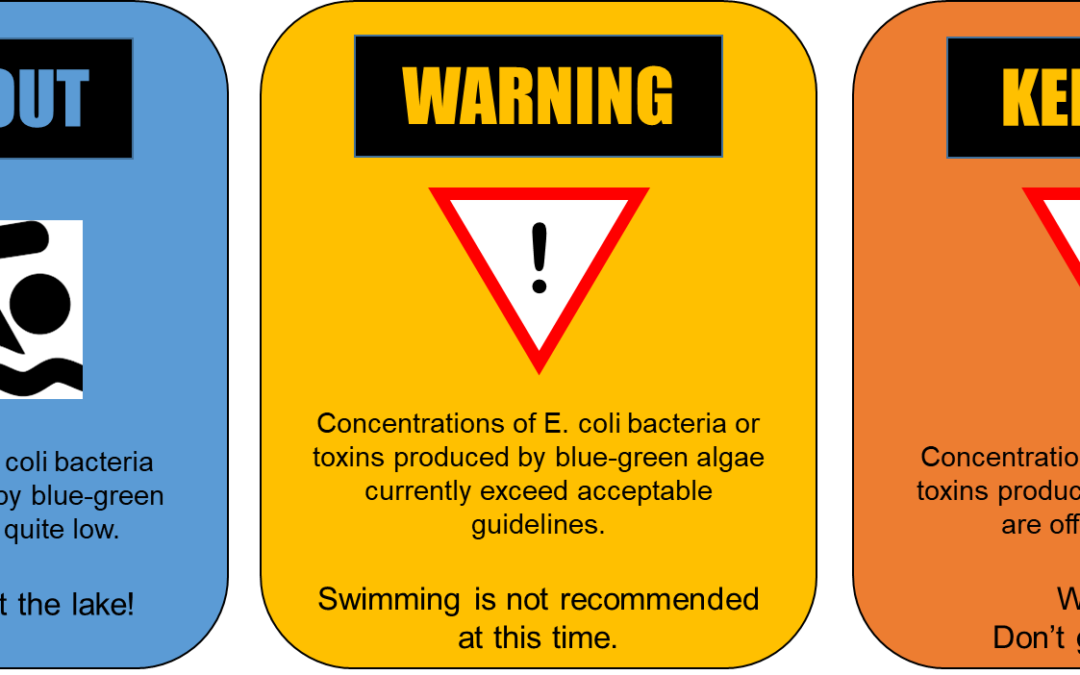
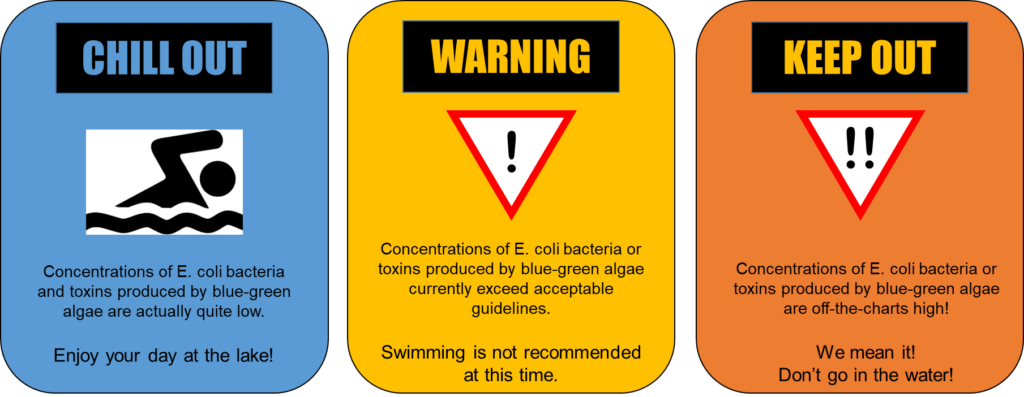
Part of the difficulty is that Iowa relies heavily on just one threshold to issue alerts and place waters on the Impaired List. Some other states have started used a red/yellow/green warning system that distinguishes between “swimming not recommended” at 235 E. coli/100mL and “beach closed” at 1000 E. coli/100mL. This is helpful if you’re a little more tolerant of risk or are doing activities that will keep your head above water. That upper limit is the same as the one used during the 2024 Summer Olympics to determine whether to hold swimming events in the River Seine.
Seine River in Paris, photo credit Erik Larson
You may recall that Paris spent $1.5 billion to clean up the Seine River in time for the 2024 Summer Olympics and still had to postpone some events because of poor water quality. Similarly, Story County Conservation has spent $3.4 million to restore Hickory Grove Lake and still had to post beach advisories four weeks last summer. There is no easy fix for these problems. However, a long-term perspective on water quality in the Seine shows how an open sewer can become a swimmable river (at least most of the time) with improvements in wastewater treatment. Yes, Iowa has more livestock than people, but I’ve been seeing some evidence that points to humans as the main source of feces and pathogens in many of Iowa’s waterways. If that’s true, then our water quality could benefit from projects to replace combined sewer systems (we still have a few), add liners to rusty sanitary sewers, get septic systems up to code, and make some overdue upgrades to sewage treatment plants.
Randy Evans was on the right track when he compared water quality in Iowa to water quality in Paris, but he only looked at one day. I’ve gone a few steps further. In the attached table, I’ve shown the best, worst, and average E. coli readings measured last year at some of Iowa’s most popular beaches and water trails. Below, I’ve put them in broad categories, benchmarked to some examples from France. I’ve also included some sites we monitor in Story County, in bold. Get ready to calibrate your disgust!
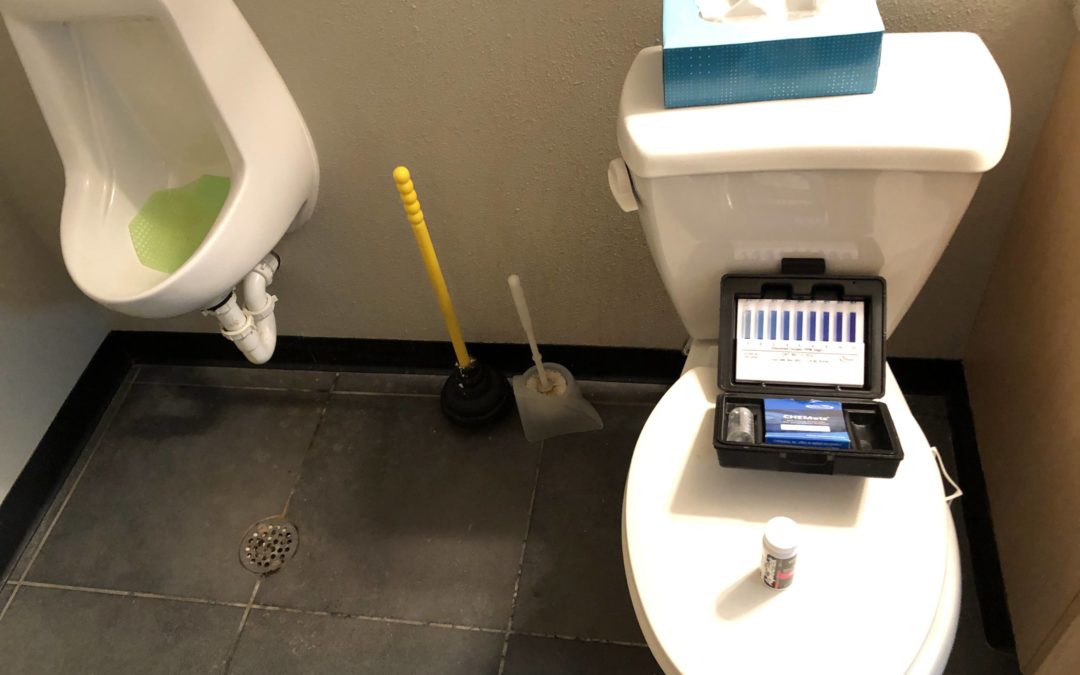
How do we measure poop in the water?
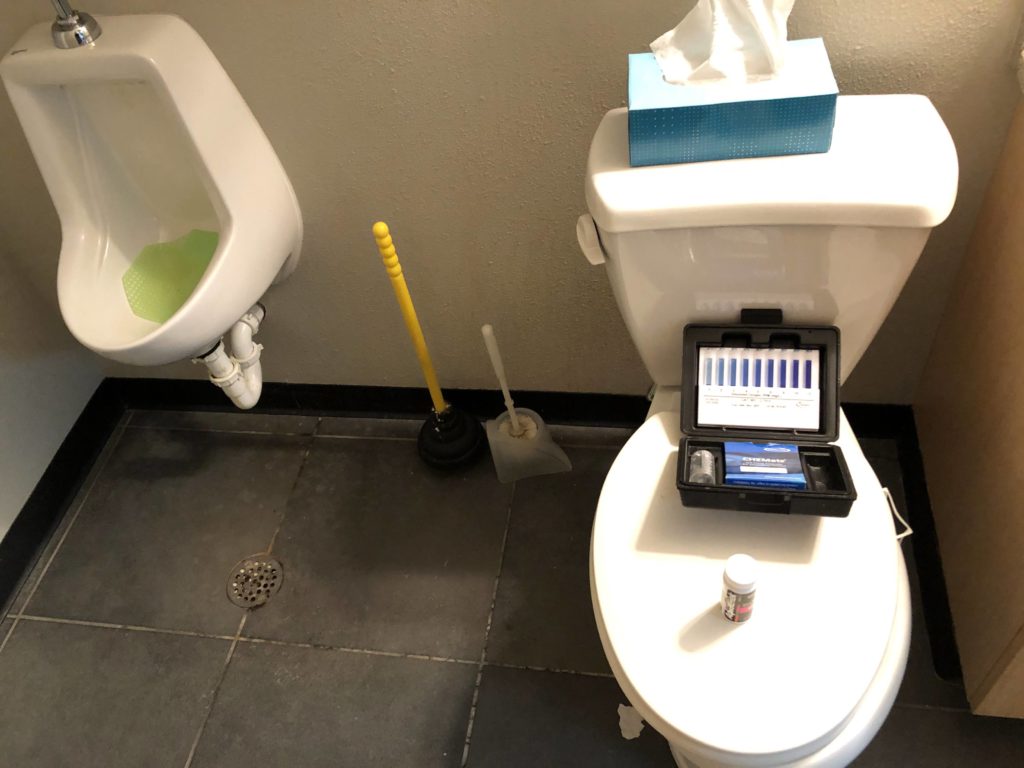
Escherichia coli is a species of bacteria found in the guts of birds and mammals. Some strains are harmless and some can put you in the hospital. It’s an easy-to-measure proxy for feces in the water, which could carry a wide variety of disease-causing microbes. E. coli can be measured directly by counting dots in a Petri dish (Colony Forming Units, CFU/100mL) or indirectly using a chemical reaction (Most Probable Number, MPN/100mL) but the results are similar enough that these units are often used interchangeably.
Typical laboratory protocols have a lower detection limit of 10 and an upper quantification limit around 24,000. With such a big range, E. coli data has to be plotted on a log scale and averages have to be expressed as a geometric mean or median—basically, worry less about the exact number and more about the number of digits.
1 digit: As clean as it gets without chlorine
Too low to detect, with typical methods (reported as <10)
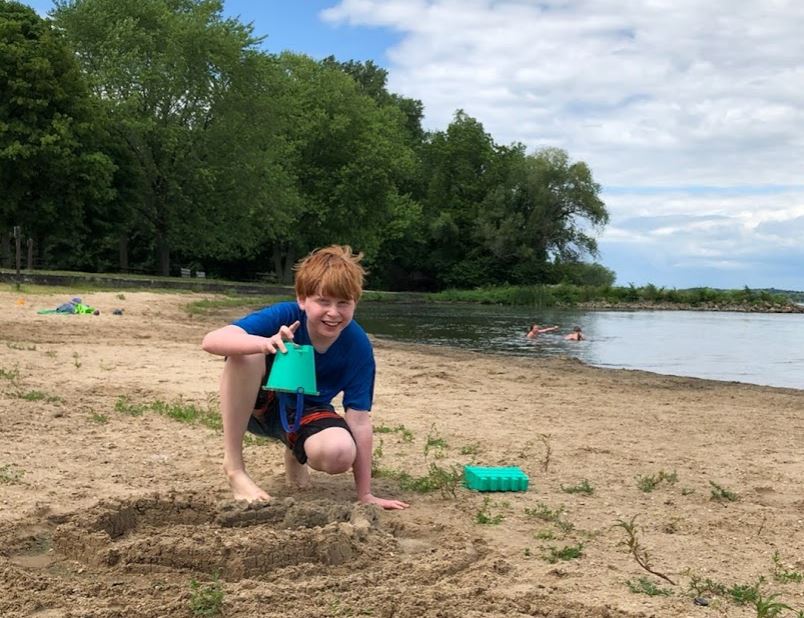
A typical beach day at Peterson Park
A typical beach day at Lake Rathbun, Gray’s Lake, or Lake Okoboji
A good day at most lakes on the impaired list
Peterson Park Beach. A favorite spot for my family during COVID lockdown and consistently clean.
2 digits: Have fun in the water!
Meets Iowa’s primary contact recreation standard (geomean <=126, single sample <=235)
A typical day at a French stream running through forest or cropland
Treated effluent from Iowa sewage treatment plants with UV disinfection
A typical beach day at Hickory Grove Lake
A typical beach day at Lake MacBride (Iowa City) or Big Creek
A bad beach day at Peterson Park
A bad beach day at Lake Okoboji
A typical day at the Charles City or Manchester whitewater parks
A good day at most rivers on the impaired waters list
Kayaker at Manchester whitewater park. I tipped and swallowed water when I attempted it, but it was probably fine.
Low 3 digits: Swim at your own risk (families)
May exceed IA primary contact recreation standard (geomean >126, single sample >235)
A typical day at a French stream running through pasture
The Seine River in Paris during the women’s marathon swim
A typical beach day at Clear Lake or Lake Darling
A bad beach day at Lake Rathbun
A bad day at the Charles City whitewater park
A typical day on the S. Skunk River water trail
Kids swimming at Clear Lake. No beach advisory on this day, but there had been other weeks.
High 3 digits: Swim at your own risk (athletes), canoe at your own risk (families)
May exceed Iowa’s secondary contact recreation standard (geomean > 630, single sample >2,880)
The Seine River in Paris during the men and women’s triathlon
A typical day at Ioway Creek in Ames
A typical day on the lower Maquoketa River (near Spragueville)
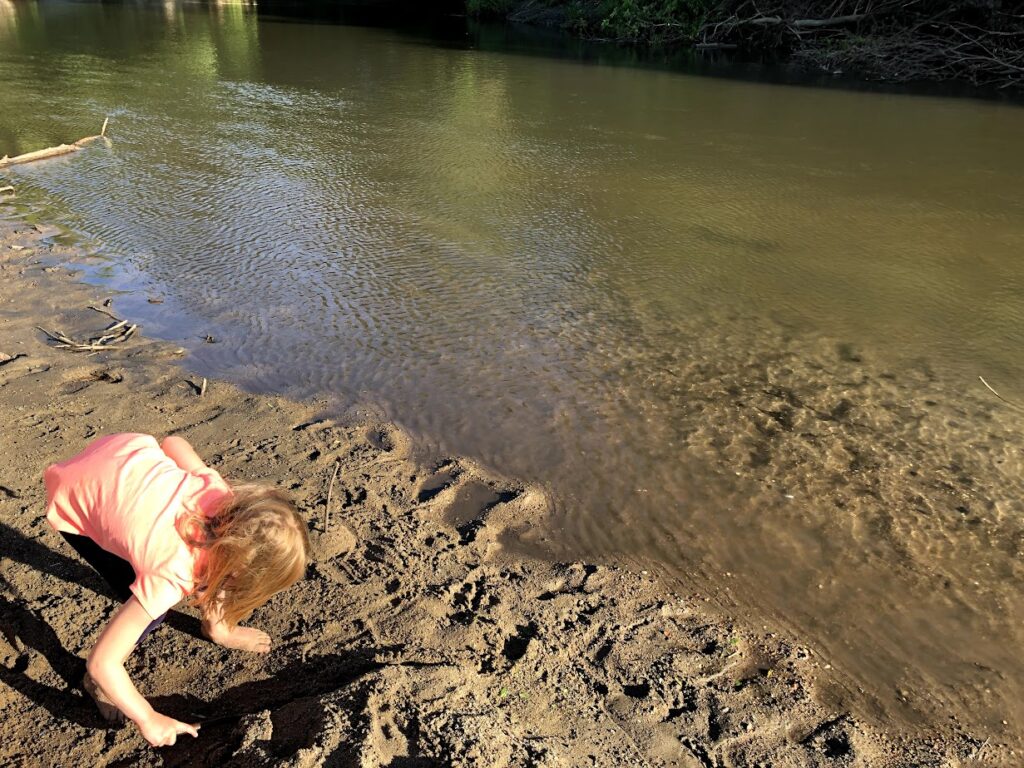
My daughter playing on a sandbar in Ioway Creek in Ames. I’m sad to say it, but I don’t think kids should be playing in this water.
4 digits: No swimming, canoe at your own risk (experienced paddlers)
Action limit for beach closures in some states (single sample > 1000)
A bad day for the Seine at the 2024 Olympics; men’s triathlon postponed
A typical day for the Seine in the early 2000s (since improved sewage treatment, but before sewer system improvements)
Treated effluent from modern Paris sewage treatment plants
A bad beach day at Gray’s Lake, Lake MacBride, Big Creek, Clear Lake, or Lake Darling
A typical day at West Indian Creek, downstream of an outdated sewage treatment plant
A bad day on the Skunk River or Ioway Creek (1.5 inch rain previous night)
A bad day at the Manchester whitewater park
Canoe trip on Ioway Creek in Boone County. I collected a water sample at this moment. E. coli measured 2,390 CFU/100mL.
5-6 digits: Stay out of the water
May be too numerous to count, with typical methods (reported as > 24,000)
A typical day for the Seine in the 1980s, before modern sewage treatment
A bad day on the Seine River in 2008, before attempts to control combined sewer overflows
A bad day at West Indian Creek (1.5 inch rain previous night), downstream of an outdated sewage treatment plant
Flash flooding in the Skunk River or Ioway Creek (June 2022). No one should be in the water during these conditions.
Two bad days on the lower Maquoketa River (near Spragueville), during high water levels
A bad day at Hickory Grove beach. Previous studies have shown that the main source of the bacteria is geese and dogs at the beach.
The new Nevada sewage treatment plant should be operational this year and will have a UV disinfection system like this one. This should make it safer for kids in Maxwell to play in Indian Creek.
Cracked sanitary sewer in Ames leaking into Ioway Creek, September 2009
No picture for this one. You’re welcome!
What is the risk of poop in the water?
Recreational water quality standards are based on epidemiological studies at swimming beaches. Researchers have found that swimmers were more likely than non-swimmers to get sick with gastroenteritis (“stomach flu”) and that illness rates were higher at beaches with more fecal indicator bacteria. Symptoms can range from mild to dangerous and are often falsely attributed to food poisoning. The EPA recommended a threshold of 126 E. coli/100mL to keep the risk of illness below a certain level for swimming, water skiing, children’s play, and other “primary contact” activities, but you should think of it as a point on a continuum rather than sharp break between “safe” and “unsafe.” Secondary contact recreation standards are used less often and involve some adjustment factors.
There are many factors that can influence whether you get sick while at the beach—how much water you swallow or get on your face, whether the source of the feces is human or animal, your general health, and previous exposure to the pathogens. There are also some challenges in accurately quantifying E. coli levels in water, which can vary a lot even within the same body of water and over a short period of time. I ran across a randomized control trial from Germany that controlled for all these factors. Some 2000 people were recruited to spend an afternoon at one of four locations (3 lakes and 1 river). Half stayed on shore and half were asked to spend ten minutes in the water, dunk their head at least three times, and report if they accidentally swallowed water. Water samples were collected every 20 minutes from the center of the swimming area and tested for E. coli. Researchers tracked how many people got sick over the next week with symptoms of a waterborne illness. Here are the results.
Water quality (E. coli/100mL), by quartile
Incidence rate of gastroenteritis
Control group
2.8%
0 to 72
1.9%
72 to 181
5.2%
181 to 379
6.6%
379 to 4,600
8.2%
What about really polluted water? An academic review board would never approve an experiment to send 931 people into a bay polluted by a combined sewer overflow, but a group of Danish triathletes was reckless enough to do it for fun. After swimming 3.8 km in water with an estimated 15,000 E. coli/100mL, 42% of them got sick with Campylobacter, Giardia, or E. coli!
There you have it, these are ballpark, intuitive judgements about when to go in the water and when to stay out, but they are informed by good science. Oops, did I just give health and safety advice without running it by anyone?
Prairie Rivers of Iowa is not a medical professional and our work is not conducted under a DNR-approved quality assurance plan, please consult your doctor and refer to section 567-61.3(3) of the Iowa Code, terms and conditions apply.
Bottom line, you may disagree with the interpretation I’ve outlined here, but there’s clearly a lot of wiggle room to enjoy Iowa’s waters without taking unnecessary risks with your health.
Before state wastewater standards went into effect in the 1960s, raw sewage could flow directly to a stream without treatment. Despite the standards, this continues in many areas today. In areas called “unsewered communities,” outdated or poorly functioning septic tanks still allow untreated wastewater into our waters. The Iowa DNR works with these communities to find funding sources and alternative treatment systems and to allow adequate time to upgrade the systems.
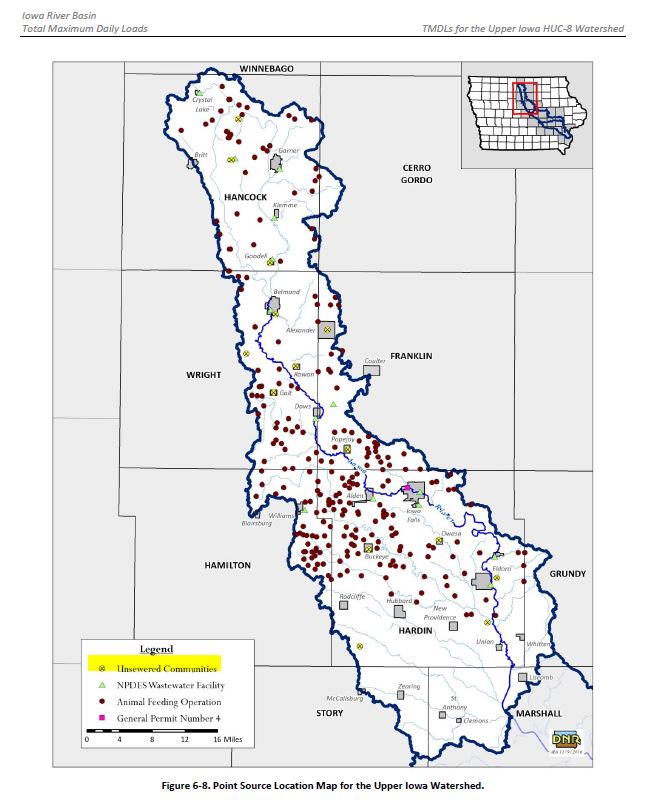
The Governor has announced that additional funding through the infrastructure bill that will be available to help unsewered communities upgrade their systems. Could this make a big difference for water quality in Iowa? Statewide, I’m not sure, but I’ve taken a closer look at the Iowa River Basin upstream of Marshalltown, where we know of 11 unsewered communities. Based on my first look at the data, it appears that these communities have little influence on E. coli in the Iowa River itself, but could make a difference for water quality in tributary streams like Beaver Creek in Hardin County.
There are 11 unsewered communities in the upper part of the Iowa River Basin, marked here with yellow circles with an X.
A Water Quality Improvement Plan for E. coli bacteria in the Iowa River Basin was released by Iowa DNR in 2017. As required by the Clean Water Act, these kinds of plans include a Total Maximum Daily Load (TMDL) of pollutants that a water body could handle and still meet water quality standards. Author James Hallmark compares this pollution budget to a family budget: regulated point sources are your fixed bills, non-point sources are your variable expenses, and the margin of safety is your emergency fund. I like this analogy and would add that without some understanding of where your discretionary spending is going, and a realistic strategy to reign it in, you’re probably not going to achieve your goals.
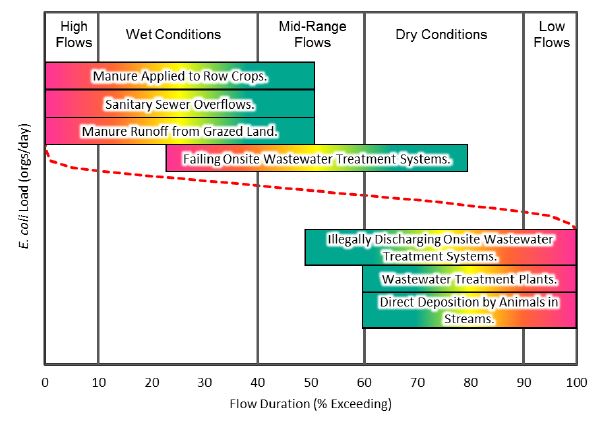
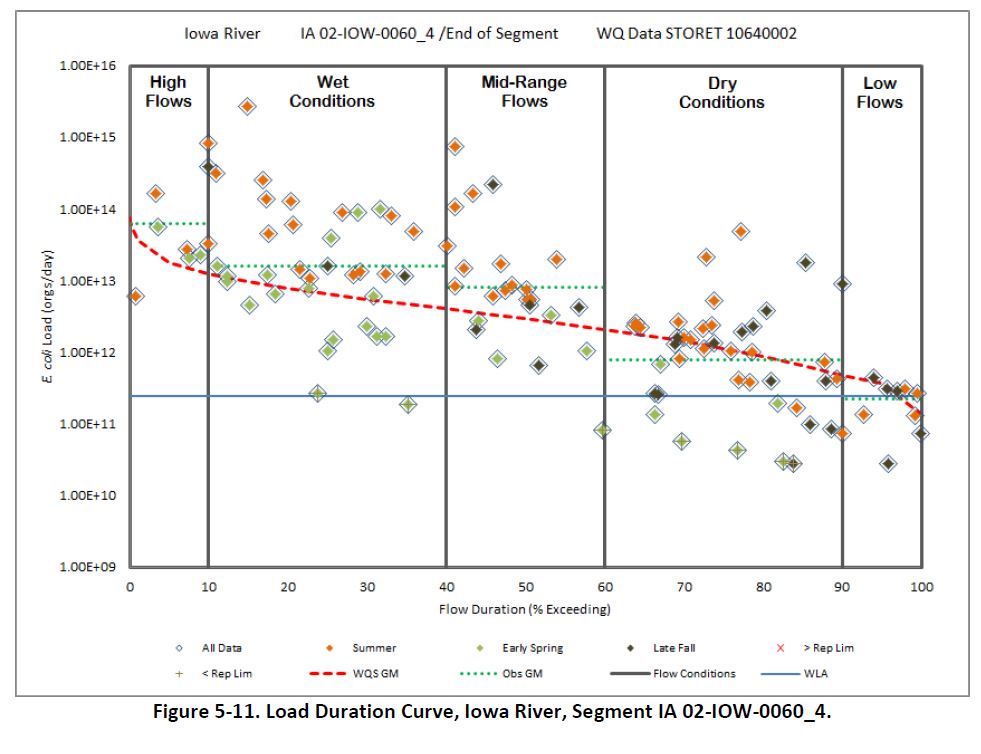
The Water Quality Improvement Plan includes a comprehensive list of E. coli sources but doesn’t single any of them out as being particularly important. It includes a list of potential solutions, but it doesn’t identify which of those would make the most difference. That’s a job for a Watershed Management Plan written with stakeholder input, apparently. However, the document is chock-full of load-duration curves, which I wrote about previously. We can use the information in these charts and tables to take the next step and begin to narrow down where and when the pollution is most serious!
In this article, I won’t pay much attention to “High Flows” and “Low Flows” because there wouldn’t be much recreational use under these conditions. I also don’t look at “mid-range” flows because there’s a bigger mix of sources influencing water quality in these conditions. A closer look at the other two categories is revealing.
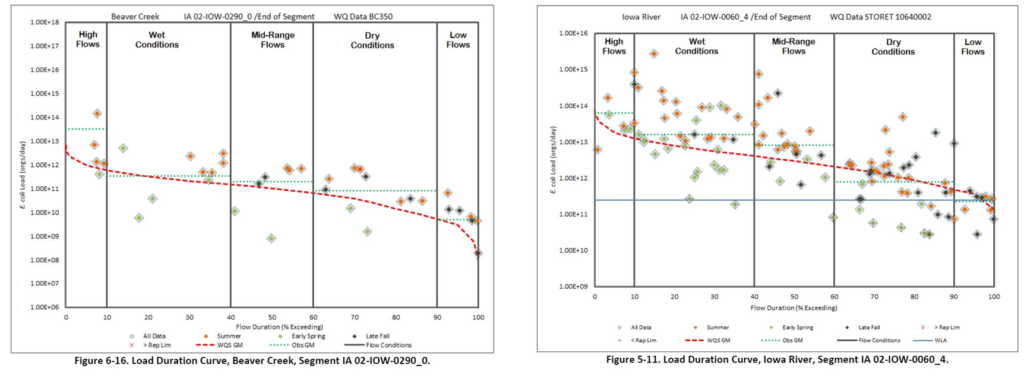
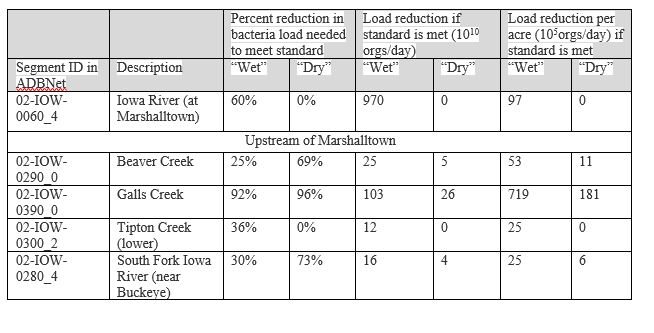
If houses are discharging raw sewage directly into a stream, we’d expect to see the highest E. coli concentrations when the stream is running lower than normal, and there’s less dilution. This is indeed what we see in Beaver Creek in Hardin County, which is downstream from the unsewered community of Owasa. Beaver Creek would need a 79% reduction in E. coli load to meet the primary contact recreation standard during “Dry Conditions” and a 38% reduction during “Wet Conditions”.
If not fully treated, sewage could be a major contributor to E. coli in some tributaries of the Iowa River.
Treated sewage also has the biggest influence when streams are lower than usual. The upper reaches of the South Fork receive effluent from the small towns of Williams and Alden, which have waste stabilization lagoons. It’s likely that some bacteria makes it through the treatment process, and this would explain why E. coli is higher during “Dry Conditions” (needing a 73% reduction) than during “Wet Conditions” (needing a 30% reduction). When their permits come up for renewal, Iowa DNR could require a UV disinfection system to ensure that E. coli in effluent is no greater than 126 colonies/100mL.
The blue line is the wasteload allocation–the regulated part of the pollution budget. Even with the best available treatment, wastewater from two towns has a big influence on the South Fork during dry conditions.
In a watershed with few people and many hogs, we’d expect to see the highest E. coli concentrations when the streams are running high and runoff from fields that receive manure application is more likely. This is indeed what we see in Tipton Creek in Hardin County, a watershed containing 47(!) CAFOs, but the levels are not especially high compared to other sites in the Iowa River basin. The recreation standard is met during “Dry Conditions” and would need a 36% reduction during “Wet Conditions.” Handled correctly (applied to flat ground at the right time, and preferably incorporated into the soil), manure and the microbes it contains can be kept out of streams. Preventing loss of the nutrients in manure is a more difficult challenge—nitrate concentrations in Tipton Creek often exceed 20 mg/L!
Despite there being a lot of hogs in the Tipton Creek watershed, E. coli levels are not especially high, relative to downstream locations.
It’s not clear to me whether primary contact recreational use of these streams is a relevant or attainable goal, or whether we should be calibrating our level of concern to the secondary contact recreation criteria. Unless there’s a permit holder affected, IDNR doesn’t investigate whether there’s enough water for kayaking in Tipton Creek, or whether children play in Beaver Creek, so the designated use is presumptive and tells me nothing.
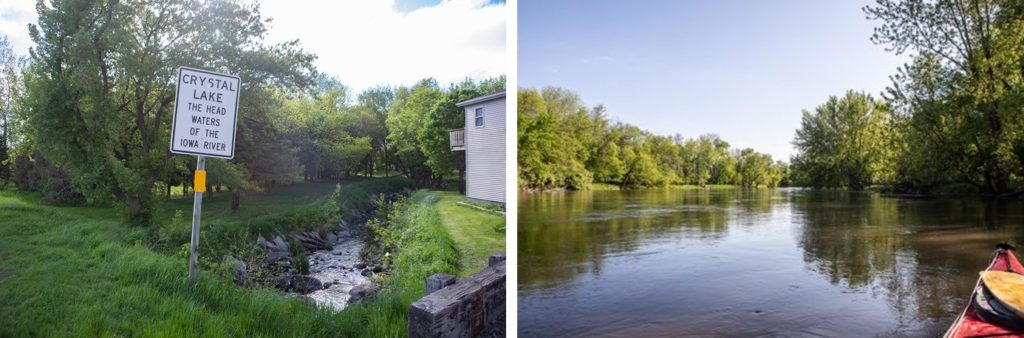
E. coli and recreation on the Iowa River is not as big a concern at Crystal Lake as it is at Steamboat Rock. Photo Credits: Ryan Adams, photojournalist
To protect fishing, paddling, and children’s play on the Iowa River itself, where and when should we focus? The Iowa River at Marshalltown needs a 60% reduction in bacteria load to meet the recreation standard during “Wet Conditions” (10-40% flow exceedance). However, it actually meets the primary contact recreation standard during “Dry Conditions” (60-90% flow exceedance). Focusing on unsewered communities in the watershed would NOT be an effective way to address this impairment.
Beaver Creek (left) has worse E. coli when it’s dry. The Iowa River near Marshalltown (right) has worse E. coli when it’s wet. If the green line is above the red line, that indicates that the E. coli geometric mean for that range of flows exceeds the standard.
Galls Creek in Hancock County has some of the worst E. coli levels measured in the basin, and would have a larger per-acre benefit to the Iowa River if standards could be met. Galls Creek has no unsewered communities but at least 20 farmsteads located along the creek that could have issues with septic systems overflowing under wet weather. The watershed has little woodland and no pasture, so land application of manure from the several CAFOs in the watershed would be most likely animal source of E. coli.
Table by Prairie Rivers of Iowa, using information from the Water Quality Improvement Plan for the Iowa River Basin
This is just a partial review of one of three HUC8s in the Iowa River Basin. There is much more to learn from further discussion with people who know the area well, or from on-site investigation. However, I hope I’ve demonstrated how we might squeeze some more insight out of the data we have, in order to make smart investments in water quality.
Water quality in the South Skunk River is still poor but has gotten better in the last five years. One reason for improvement is a new disinfection system at the Ames wastewater treatment plant.
Dr. Chris Jones recently shared a water quality index he developed for Iowa rivers, combining five important water quality metrics. Of the 45 sites in the Iowa DNR’s ambient monitoring network, the South Skunk River near Cambridge scored “poor” and ranked 34th overall. This site also has the 3rd highest phosphorus and the 5th highest E. coli levels.
A follow-up article looked whether the current (2016-2020) water quality index has changed from previous decades. Most rivers have stayed the same or gotten worse, but the South Skunk had a better score. Three of the metrics (total phosphorus, total nitrogen, and E. coli bacteria) improved, while one (turbidity, a measure of sediment in the water) got worse.
Phosphorus and muddy water usually go together, so this odd pattern demanded some explanation. I did my own analysis of the data, curious if the changes were happening under drier conditions (when wastewater has a bigger influence), wetter conditions (when agricultural runoff has a bigger influence) or both.
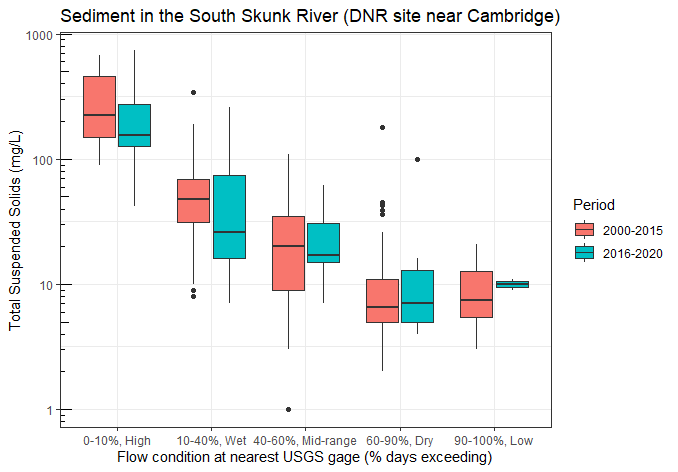
See last week’s post for an explanation of the flow categories I’m using. I use a lot of boxplots, which show both the central tendency and the spread of the data. The lower end, middle, and upper ends of the box are the 25th, 50th (median) and 75th percentiles. The “whiskers” show the maximum and minimum, unless they’re really far out there, in which case the “outliers” represented by dots. Water quality data never fits a bell curve, so lopsided boxes and outliers are to be expected.
It turns out that the river didn’t get any muddier (it got less muddy) when you compare wet conditions to wet conditions and mid-range conditions to mid-range conditions.
It’s just that the past five years were a little wetter and so a larger share (43% vs 29%) of the samples were collected during wet conditions when the river was moving swiftly and carrying more sediment. A smaller share (25% vs 42%) of the samples were collected during dry and low-flow conditions when the water is usually clear. That made the average sediment concentration increase.
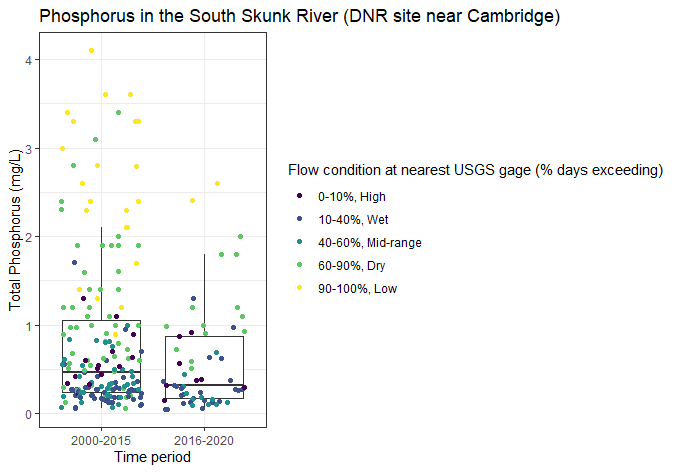
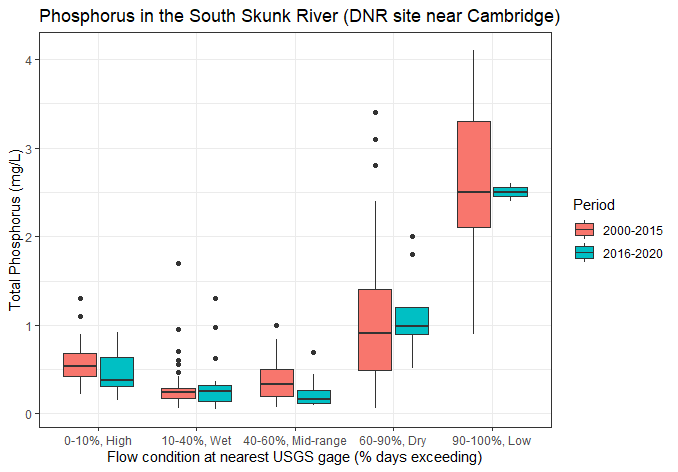
Weather also can explain trends in phosphorus. In the past five years, a smaller share of the samples were collected during dry and low-flow conditions when phosphorus concentrations are especially high. That made the average phosphorus concentration decrease.
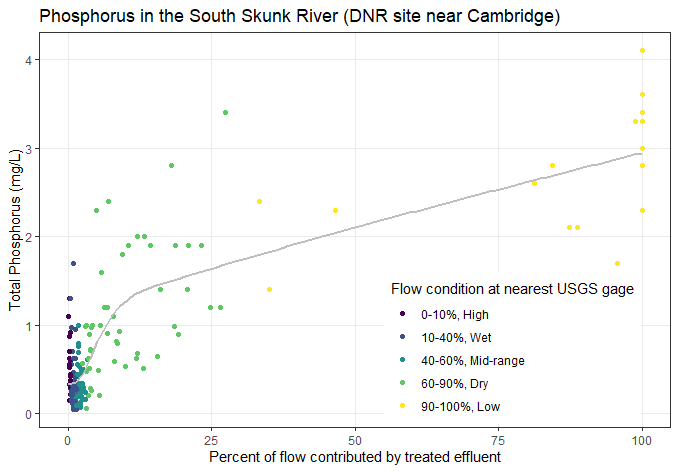
Why is phosphorus so high when it’s dry? The monitoring site in question is just below the outfall of Ames Water Pollution Control Facility on 280th St, about 4 miles north of Cambridge. This facility discharges over 6 million gallons a day of treated wastewater. When conditions are dry, the effluent is less diluted, and so phosphorus in the stream approaches phosphorus levels in the effluent (which averages 3.8 mg/L), as shown in the graph below. This year we’ve also monitored West Indian Creek below the Nevada wastewater treatment plant and have seen the same pattern.
Wastewater treatment plants are regulated to minimize the impact on receiving waters and the Ames WPC Facility has one of the best compliance records in the nation. However, while the treatment process is very good at removing ammonia, solids, and oxygen-depleting substances, the process is not that effective for removing nutrients.
The Iowa Nutrient Reduction Strategy is not voluntary for wastewater treatment plants. The Ames Water and Pollution Control Department commissioned a feasibility study as a condition of its permit, which determined that the facility could achieve a 67% reduction in total nitrogen and a 75% reduction in total phosphorus by replacing its trickling filters with an activated sludge treatment system. This new system will be phased in as the filters reach the end of their useful life (starting in 2027) and will cost $39.6 million.
In the last five years we have not seen any reduction in phosphorus during dry and low-flow conditions when wastewater treatment systems have the biggest influence. However, there was a reduction in phosphorus* under mid-range and high flow conditions! This is really interesting–I’ll have to look at some other data sets to see whether it holds up and whether we can link it to conservation practices in the watershed.
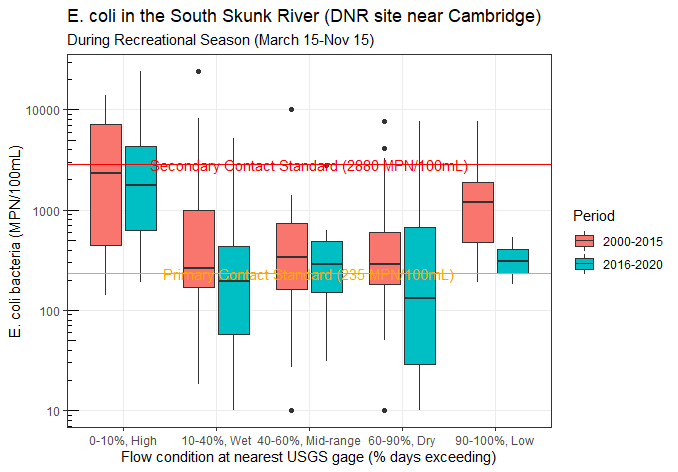
For E. coli, we see improvement across all conditions, with the largest improvement during low-flow conditions* when wastewater has the biggest influence.
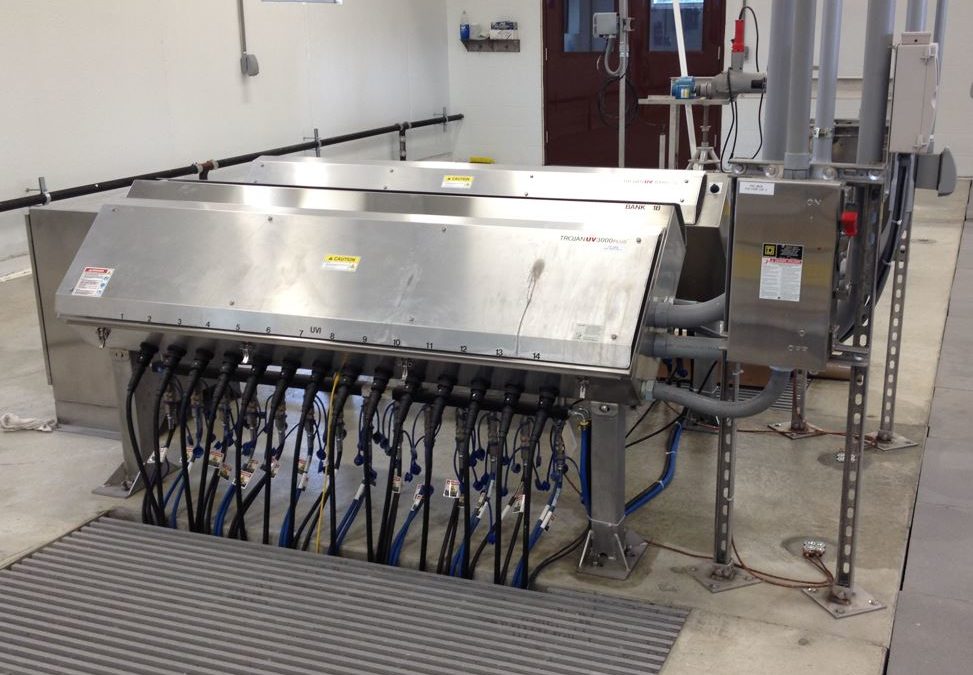
The effluent discharged to the river has gotten a lot cleaner since the Ames Water Pollution Control Facility built $2 million disinfection system using ultra-violet (UV) light. The system was completed in March of 2015. During the recreational season (March 15-Nov 15), treated effluent passes through two banks of lights that kill microbes. Prior to this, some E. coli and pathogens could make it through the system and end up in the river. Chlorination, a good solution for disinfecting drinking water and swimming pools, is not ideal for wastewater because it can harm fish.
Kris Evans, an environmental engineer for the City of Ames and the project manager, said this about the system:
“By using UV we continue to be “chemical free” for treatment of the wastewater and it’s much safer for staff since they don’t have to chlorinate and dechlorinate. When flow is low at the plant, we are able to lower the intensity of the bulbs to save energy and still meet permit limits; as flow increases so does the UV light intensity. The City started design of the UV system before it was mandated in a permit; we knew it was coming, but wanted to be proactive in the treatment of water, making it safer for those who recreated in the river. It was also the first project the department funded through an State Revolving Fund (SRF) loan.”
We still see high E. coli levels in other streams that receive effluent, but smaller wastewater treatment systems are also making the switch to comply with new permit requirements. In Story County, Gilbert added a UV disinfection system in 2019, the Squaw Valley HOA completed theirs in 2020, and Nevada will build a new wastewater treatment plant in 2022 that includes UV disinfection.
* I’ve written before about the challenges of detecting water quality trends. I’m pleased to report that two of the trends discussed here (a reduction in phosphorus at mid-range flow conditions, and a reduction in E. coli in dry and low-flow conditions) were statistically significant at 90% confidence level, using a test of the difference between medians. The approach employed here (sorting by flow conditions) may be a good way to control for weather and reach more reliable conclusions. It’s exciting to have some good news that holds up to further analysis!