You can lead a horse to water…

You can lead a horse to water…

Prairie Rivers of Iowa is not the sort of environmental group that follows the goings on at the state capitol (that would be our friends at the Iowa Environmental Council) but the success of our watershed projects is very much affected by state and federal policy.  A big part of our work is environmental education, but often “is a river still polluted and what can we do about it” is a legal and political question as much as a scientific question.  I hope this tricky case study from the Cedar River will illustrate why we need more people to learn about and talk about environmental policy to make it more transparent, fair, and effective.

My New Year’s resolution for 2023 is to write fewer long articles like this one and more bite-sized lessons.  For the 50th anniversary of the Clean Water Act, we’ll be sharing 50 short facts (one a week) on social media about that important and complicated law.  Here are the first five:

1) The Clean Water Act (CWA) is 50 years old but it still has a big influence on how we evaluate and protect water quality in rivers and lakes.

2) The Clean Water Act is a federal law but is implemented at the state level, with oversight from the Environmental Protection Agency (EPA). In Iowa, the Department of Natural Resources (DNR) is responsible for issuing permits, setting standards, and assessing the condition of rivers and lakes.

3) The Clean Water Act requires public notice and public comment for many decisions. Staff at environmental agencies read and take seriously public comments, so it’s worth speaking up and having your voice heard.

4) The Clean Water Act also gives concerned citizens the standing to file suit if there is an ongoing violation that hasn’t been enforced, or if the Environmental Protection Agency is not fulfilling its mandatory duties.

5) Decisions by courts and federal agencies can come into conflict with state legislatures, which control the budgets for state agencies. For example, in Iowa there are over 700 river segments and lakes on the waiting list for a cleanup plan, because Department for Natural Resources doesn’t have enough staff to keep up with it.

We can sum that up with the old saying: “You can lead a horse to water, but you can’t make it drink.” 

In November, the Iowa Department of Natural Resources (DNR) made the unusual decision to withdraw a cleanup plan (or TMDL) for nitrate in a part of the Cedar River that supplies drinking water to Cedar Rapids.  Click here for the original plan, here for the public notice of its withdrawal, and here for the Iowa Environmental Council’s response, which provides some valuable context.  TMDL stands for “Total Maximum Daily Load.”  TMDLs are pollution budgets that explain where pollution is coming from and how much needs to be reduced in order to protect fisheries, drinking water, or recreation in an impaired river or lake.  They are often used to set permit conditions for upstream sewage treatment plants and industrial facilities.


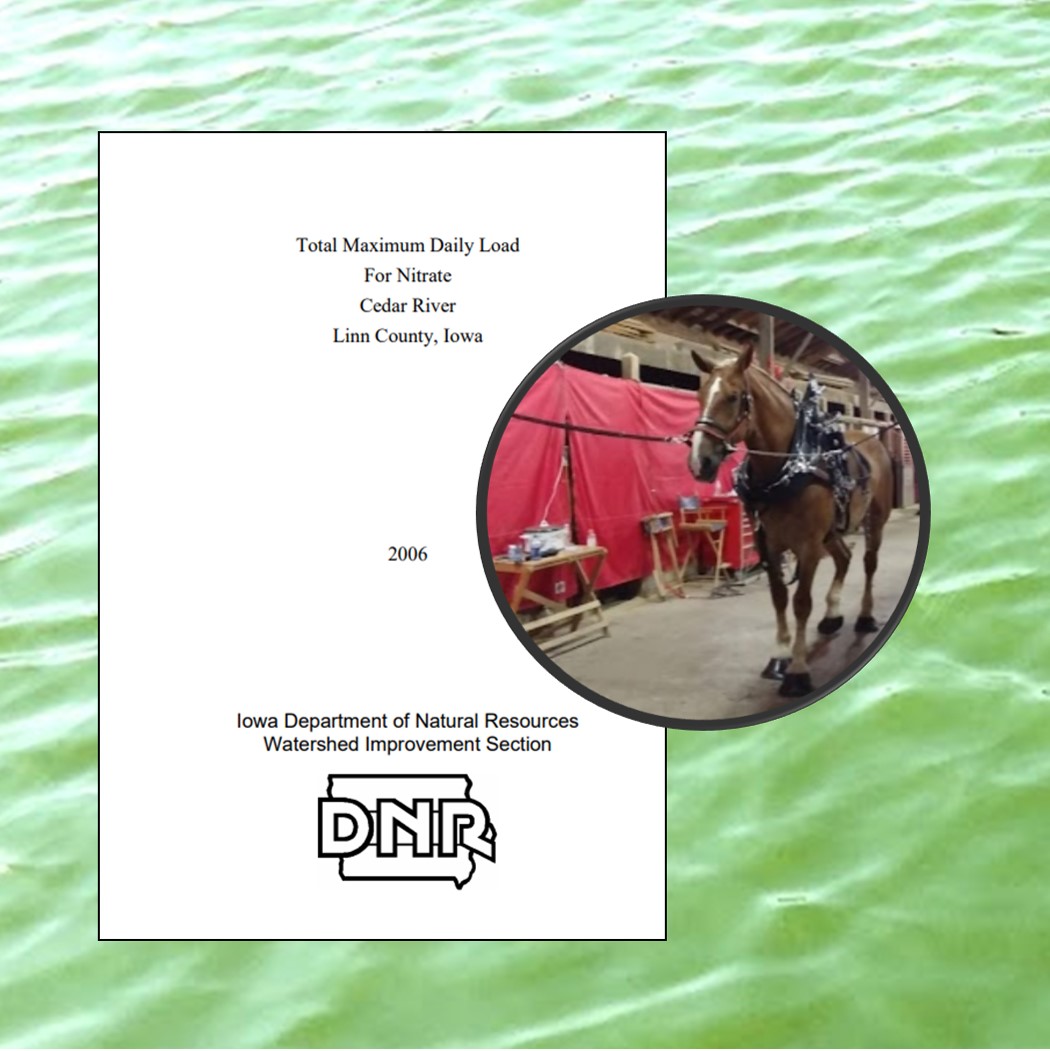
leading a horse to polluted water in the the Cedar River

There is a joke that TMDL stands for “Too Many D*** Lawyers.”  Most state agencies ignored the part of the Clean Water Act dealing with TMDLs until a series of lawsuits by environmental groups in the 1990s.  The Cedar River TMDL was actually written under a court order in 2006.  The TMDL estimated that only 9% of the nitrogen in the Cedar River watershed was coming from regulated point sources of pollution like sewage treatment plants and factories.  Most of the reductions would need to come from agriculture, through voluntary conservation programs.  Still, the plan called for capping the pollution from point sources at the 2006 amount and not adding any more.  However, it seems that the DNR did not follow the TMDL when writing permits over the next decade, and did not enforce permit violations.

One of the most surprising violations is from a drinking water treatment plant in Waverly.  I don’t think of drinking water treatment as generating pollution, and maybe that’s why it was initially overlooked.  The facility uses reverse osmosis, which gives you cleaner water on one side of the membrane and dirtier water on the other side.  The facility has been discharging wastewater with 37.7 mg/L of nitrate into the Shell Rock River (a tributary of the Cedar).  When the DNR added a permit condition that nitrate be brought down to 9.5 mg/L, the Iowa Regional Utilities Association protested, claiming that compliance would cost them $1 million.  If my math is correct, bringing the facility into compliance would avoid only 5 tons of nitrogen pollution per year.  The TMDL calls for a reduction of 9,999 tons per year.  Enforcing this permit as written does not seem like a fair or effective way to protect water quality in the river, but I suspect there would be an easy fix if the TMDL were revised.

The Clean Water Act provides two ways to set the limits in a permit.  Water quality-based effluent limits reference the pollution budget in a TMDL.  They’re only for facilities that discharge to an impaired water body.  Technology-based effluent limits are set statewide, based on the level of treatment that’s possible with widely available, not-too-expensive technologies. The Iowa Nutrient Reduction Strategy included new technology-based effluent limits for nitrate and phosphorus, affecting 157 municipal and industrial wastewater treatment systems.  They must find a way to reduce their total nitrogen by 66% and their total phosphorus by 75% or else complete a feasibility study to show it would be cost-prohibitive to do so.  Some facilities are already making the upgrades, some won’t be done until 2027.  For the largest point source in the TMDL (the Waterloo sewage treatment plant), that means a reduction of some 333 tons of nitrogen a year.

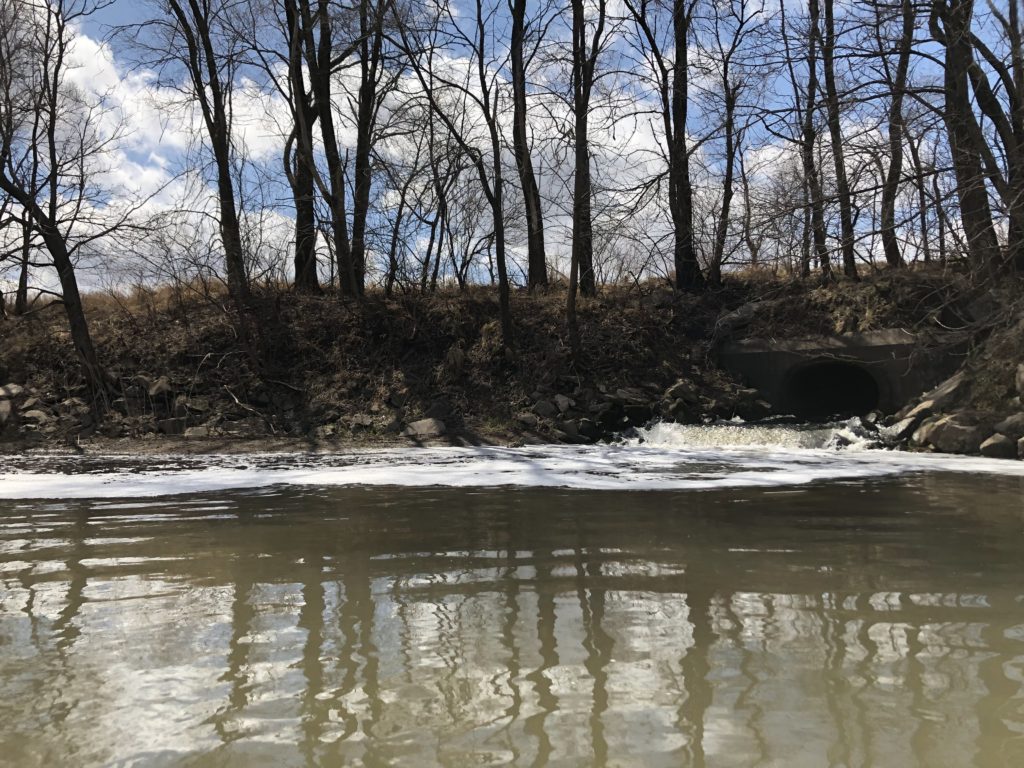
Effluent from a wastewater treatment plant entering a river.

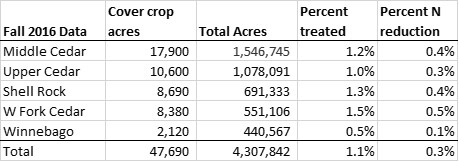
Of course, most of the nitrate reduction goal for the watershed (9,999 tons) will need to come from agriculture.  We don’t know how that’s going because Iowa doesn’t have a current or complete tracking system.  The most recent data I could find for cover crops by watershed is 7 years old.  At that time, there were not enough acres to make a noticeable difference in water quality in the river.

Cover crops in the Cedar River watershed
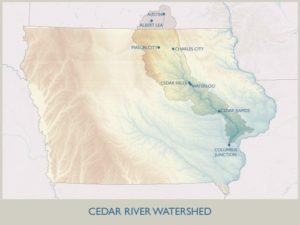
Cedar River watershed map, courtesy of IIHR

Side note: The Cedar River starts in Minnesota and has several major tributaries, including the Shell Rock River, West Fork, and Winnebago.  It’s a big watershed that usually gets divided into smaller chunks (i.e. there are separate watershed management authorities for the Upper, Middle, and Lower Cedar).  The TMDL actually recommended prioritizing conservation in the Upper Cedar, but at some point, the focus got shifted to the Middle Cedar.

Are water quality based-effluent limits still needed?  Maybe not, but the frustrating thing about this case is that we get don’t get a revised pollution budget that shows how other strategies will protect drinking water in Cedar Rapids.  We don’t get a public debate over what’s not working with this law and an opportunity to change it.  Instead, we get excuses for why a revised TMDL can’t be done and isn’t needed.  Some of those excuses are legitimate: the chronically underfunded DNR has a lot of TMDLs to write and not enough staff to do it.  Some of the excuses are flimsy: apparently, the document mishandled nitrogen units in a way that was too subtle for me to notice on the first read-through but serious enough to make the whole thing unworkable.

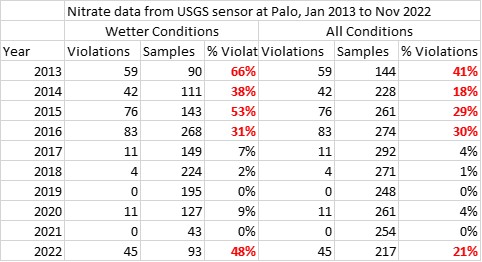
Another excuse—that the Cedar River is no longer impaired—seemed like a mistake at first but turned out to be technically correct on closer inspection.  “No longer impaired” means that fewer than 10% of the samples collected during the last two assessment periods (2016-2018 and 2018-2020) exceeded the drinking water standard.  I’ve double-checked this with another source of data and think this assessment holds up, even if we account for weather.  It’s just premature.  Nitrate was back up in 2022.

nitrate violations in the Cedar River

Well, you know what they say.  You can lead a state agency to water, but they can’t make it drinkable.

(Apologies to my respected colleagues at DNR.  I can’t resist a good pun!)

Are small towns a big problem for water quality?

Are small towns a big problem for water quality?

Before state wastewater standards went into effect in the 1960s, raw sewage could flow directly to a stream without treatment. Despite the standards, this continues in many areas today. In areas called “unsewered communities,” outdated or poorly functioning septic tanks still allow untreated wastewater into our waters.  The Iowa DNR works with these communities to find funding sources and alternative treatment systems and to allow adequate time to upgrade the systems.

Iowa DNR: Rural Community Sewers

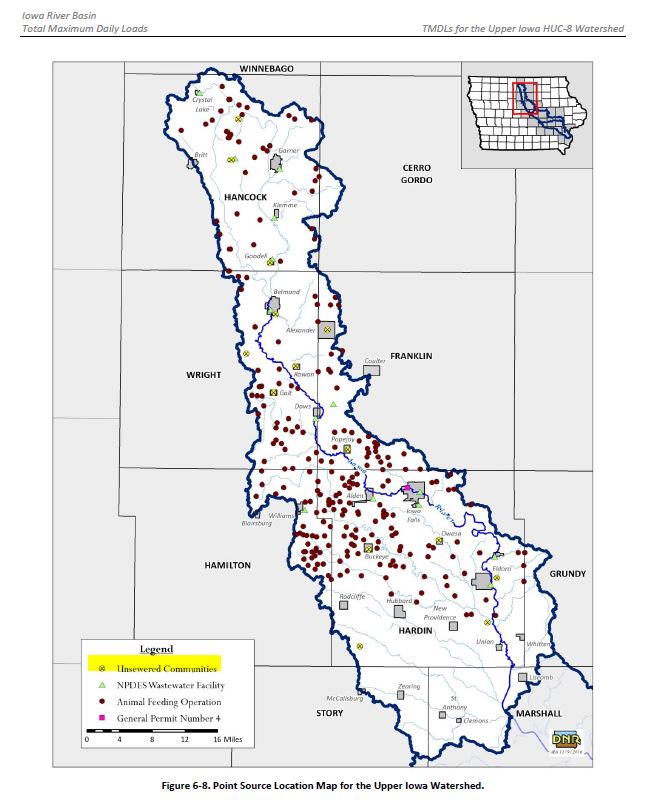
The Governor has announced that additional funding through the infrastructure bill that will be available to help unsewered communities upgrade their systems.  Could this make a big difference for water quality in Iowa?  Statewide, I’m not sure, but I’ve taken a closer look at the Iowa River Basin upstream of Marshalltown, where we know of 11 unsewered communities.  Based on my first look at the data, it appears that these communities have little influence on E. coli in the Iowa River itself, but could make a difference for water quality in tributary streams like Beaver Creek in Hardin County.

There are 11 unsewered communities in the upper part of the Iowa River Basin, marked here with yellow circles with an X.

A Water Quality Improvement Plan for E. coli bacteria in the Iowa River Basin was released by Iowa DNR in 2017.  As required by the Clean Water Act, these kinds of plans include a Total Maximum Daily Load (TMDL) of pollutants that a water body could handle and still meet water quality standards.  Author James Hallmark compares this pollution budget to a family budget: regulated point sources are your fixed bills, non-point sources are your variable expenses, and the margin of safety is your emergency fund.  I like this analogy and would add that without some understanding of where your discretionary spending is going, and a realistic strategy to reign it in, you’re probably not going to achieve your goals.

The Water Quality Improvement Plan includes a comprehensive list of E. coli sources but doesn’t single any of them out as being particularly important.  It includes a list of potential solutions, but it doesn’t identify which of those would make the most difference.  That’s a job for a Watershed Management Plan written with stakeholder input, apparently. However, the document is chock-full of load-duration curves, which I wrote about previously.  We can use the information in these charts and tables to take the next step and begin to narrow down where and when the pollution is most serious!

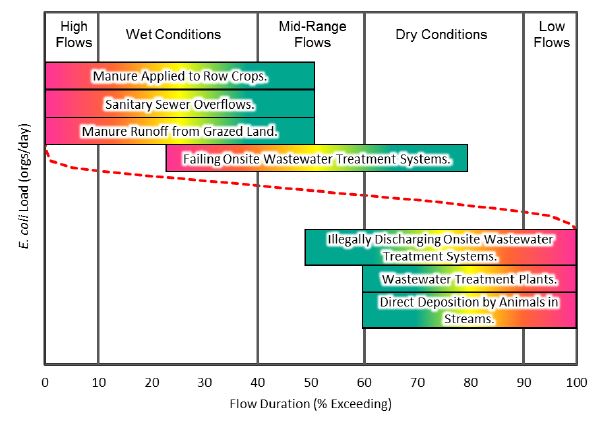
In this article, I won’t pay much attention to “High Flows” and “Low Flows” because there wouldn’t be much recreational use under these conditions. I also don’t look at “mid-range” flows because there’s a bigger mix of sources influencing water quality in these conditions. A closer look at the other two categories is revealing.

common sources of bacteria for different flow conditions

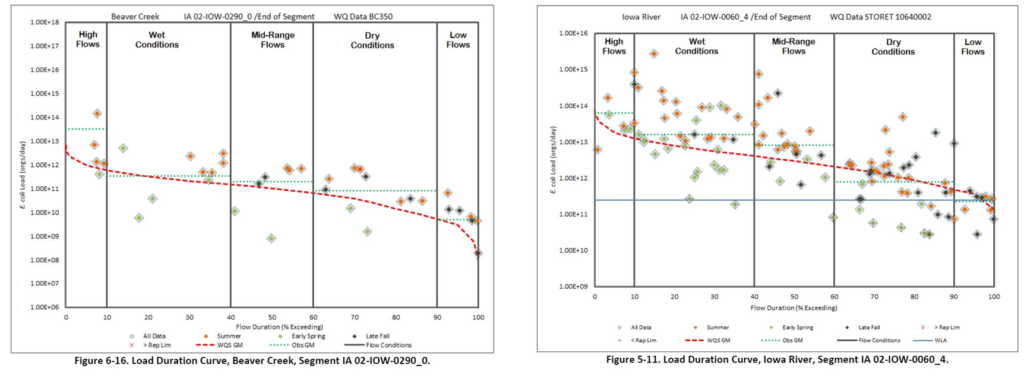
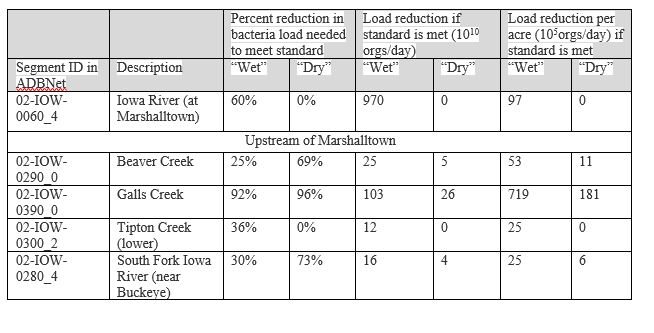
If houses are discharging raw sewage directly into a stream, we’d expect to see the highest E. coli concentrations when the stream is running lower than normal, and there’s less dilution.  This is indeed what we see in Beaver Creek in Hardin County, which is downstream from the unsewered community of Owasa.  Beaver Creek would need a 79% reduction in E. coli load to meet the primary contact recreation standard during “Dry Conditions” and a 38% reduction during “Wet Conditions”.

If not fully treated, sewage could be a major contributor to E. coli in some tributaries of the Iowa River.

Treated sewage also has the biggest influence when streams are lower than usual.  The upper reaches of the South Fork receive effluent from the small towns of Williams and Alden, which have waste stabilization lagoons.  It’s likely that some bacteria makes it through the treatment process, and this would explain why E. coli is higher during “Dry Conditions” (needing a 73% reduction) than during “Wet Conditions” (needing a 30% reduction).  When their permits come up for renewal, Iowa DNR could require a UV disinfection system to ensure that E. coli in effluent is no greater than 126 colonies/100mL.

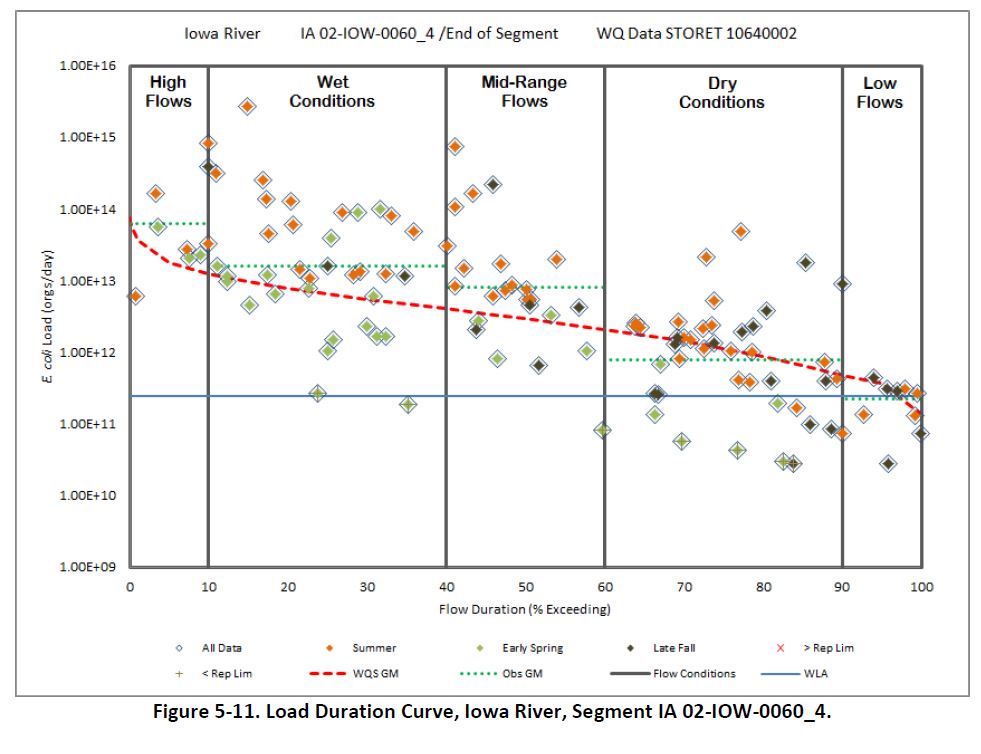
The blue line is the wasteload allocation–the regulated part of the pollution budget. Even with the best available treatment, wastewater from two towns has a big influence on the South Fork during dry conditions.

In a watershed with few people and many hogs, we’d expect to see the highest E. coli concentrations when the streams are running high and runoff from fields that receive manure application is more likely.  This is indeed what we see in Tipton Creek in Hardin County, a watershed containing 47(!) CAFOs, but the levels are not especially high compared to other sites in the Iowa River basin.  The recreation standard is met during “Dry Conditions” and would need a 36% reduction during “Wet Conditions.”  Handled correctly (applied to flat ground at the right time, and preferably incorporated into the soil), manure and the microbes it contains can be kept out of streams.  Preventing loss of the nutrients in manure is a more difficult challenge—nitrate concentrations in Tipton Creek often exceed 20 mg/L!

Despite there being a lot of hogs in the Tipton Creek watershed, E. coli levels are not especially high, relative to downstream locations.

It’s not clear to me whether primary contact recreational use of these streams is a relevant or attainable goal, or whether we should be calibrating our level of concern to the secondary contact recreation criteria. Unless there’s a permit holder affected, IDNR doesn’t investigate whether there’s enough water for kayaking in Tipton Creek, or whether children play in Beaver Creek, so the designated use is presumptive and tells me nothing.

E. coli and recreation on the Iowa River is not as big a concern at Crystal Lake as it is at Steamboat Rock.
Photo Credits: Ryan Adams, photojournalist

To protect fishing, paddling, and children’s play on the Iowa River itself, where and when should we focus?  The Iowa River at Marshalltown needs a 60% reduction in bacteria load to meet the recreation standard during “Wet Conditions” (10-40% flow exceedance).  However, it actually meets the primary contact recreation standard during “Dry Conditions” (60-90% flow exceedance).  Focusing on unsewered communities in the watershed would NOT be an effective way to address this impairment.

Beaver Creek (left) has worse E. coli when it’s dry. The Iowa River near Marshalltown (right) has worse E. coli when it’s wet. If the green line is above the red line, that indicates that the E. coli geometric mean for that range of flows exceeds the standard.

Galls Creek in Hancock County has some of the worst E. coli levels measured in the basin, and would have a larger per-acre benefit to the Iowa River if standards could be met.  Galls Creek has no unsewered communities but at least 20 farmsteads located along the creek that could have issues with septic systems overflowing under wet weather.  The watershed has little woodland and no pasture, so land application of manure from the several CAFOs in the watershed would be most likely animal source of E. coli.

Table by Prairie Rivers of Iowa, using information from the Water Quality Improvement Plan for the Iowa River Basin

This is just a partial review of one of three HUC8s in the Iowa River Basin. There is much more to learn from further discussion with people who know the area well, or from on-site investigation.  However, I hope I’ve demonstrated how we might squeeze some more insight out of the data we have, in order to make smart investments in water quality.