The economics of nitrogen have changed. Has our thinking?

The economics of nitrogen have changed. Has our thinking?

Clear Creek sign with rearview mirror

Revised December 10

It sounds too good to be true, wrote Neil Hamilton in a 2021 opinion piece.  Reducing nitrogen fertilizer application rates to the Maximum Return to Nitrogen (MRTN) recommended by Iowa State University promised to save farmers money while keeping nitrate out of the rivers and greenhouse gases out of the atmosphere.  In retrospect, it was too good to be true.

Reducing fertilizer rates will cut into profits (for most farmers)

Early this year, ISU researchers published a study in Nature Communications showing that the amount of nitrogen fertilizer required to maximize yield (the agronomic optimum) and maximize profits (the economic optimum) have been steadily increasing, driven partly by corn genetics and partly by weather.  The economic optimum is always lower than the agronomic optimum (the revenue from those last few bushels isn’t enough to pay for the fertilizer) but the difference between the two is getting smaller.  I wrote about this in July, but since then I’ve had a chance to download and explore the data used in the study.  Here are the trends in optimal nitrogen application rates for just the sites in Iowa, compared to actual nitrogen application rates, which I estimated using a combination on IDALS fertilizer sales data and INREC survey data.  For more details on the data I used to estimate actual nitrogen application, read this attachment.

The scenarios in the Iowa Nutrient Reduction Strategy were based on data from 2006-2010.  At that time, it would have been possible for farmers to reduce nitrogen application rates on corn following soybeans from 151 lbs/acre to 133 lbs/acre while increasing profits, on average.  However, those figures were already out of date when the Iowa Nutrient Reduction Strategy was released in 2013, and in the decade since, fertilizer application rates have levelled off while the amount of nitrogen needed to maximize yields or profit has continued to increase.  A minority of farmers may still find opportunities to boost profits by reducing nitrogen application, but average rates are now below the economic optimum.

This part of the study looks solid and matches what I’ve seen from other sources.  Practical Farmers of Iowa have done their own trials and found that a majority of their participants were able to save money by reducing nitrogen rates in an especially dry year, but in a more typical year only 41% of farmers saw potential for savings.

Reducing fertilizer rates could still have significant water quality benefits

Farmers no longer have an economic incentive to reduce rates (on average) but it’s not hard to imagine policies that could shift the incentives by making it cheaper or less risky to apply at low rates, or more expensive to apply at high rates.

The ISU study includes an “environmental optimum nitrogen rate” that hints at that.  The authors used a crop systems model to estimate nitrous oxide emissions and nitrate leaching for different scenarios, assigned a price to the pollution, and calculated the nitrogen application rate that would be economically optimal if those costs were reflected in the marketplace.  Instead of evaluating the environmental benefits of reducing rates from current levels, they estimate the impacts of reducing rates (for corn after soybeans) from an economic optimum of 143 lbs/acre to an environmental optimum of 116 lbs/acre.  Those are averages for the entire 20 year period and not at all relevant today.  Oops!  Because of this mistake, they conclude that “a reduction in N fertilizer rate towards improving sustainability will not have the anticipated reduction in environmental N losses because of the nonlinear relationship between N rate and N loss.”

Actually, the non-linear (curved) relationship between nitrogen application rates and nitrate pollution implies that rate reduction will have bigger benefits now than it did when rates were lower.  The figures below contrast some outdated assumptions with new reality.

The increase in fertilizer rates has been bad for water quality

In most presentations and interviews about the Iowa Nutrient Reduction Strategy, ISU faculty correctly point out that fertilizer management alone is not enough to meet our water quality goals and emphasize the need for a variety of conservation practices.  However, every scenario in the INRS assumed that fertilizer application rates would go down.  It may not be possible to meet our goals now that fertilizer rates have gone up.

Based on the increase in fertilizer rates for corn after soybeans (from 151 lbs/acre in 2007 to 173 lbs/acre since 2017), we would expect a 16% increase in nitrate concentration in drainage water.  The 3.8 million acres of cover crops reported in recent INREC aren’t enough to undo the damage.  Nitrate in streams is also affected by weather, changes in land use, and other practices not modeled here, but fertilizer rates and cover crops do help to explain why nitrate concentrations in many streams peaked between 2013 and 2015 and have fallen since.

What about continuous corn?

Nitrogen application rates for corn after soybeans have gone up, but application rates for continuous corn may actually have gone down.  I say “may” because we didn’t have good baseline data.  Because corn stover ties up a lot of nitrogen as it decomposes, growing corn after corn requires higher nitrogen application rates to achieve the same yield.  The confusing Figure 5 in the Nature Communications paper looks at the yield penalty for reducing nitrogen rates from the economic optimum to the “environmental optimum,” which is what it would make economic sense for farmers to apply if the societal costs of pollution were reflected in the marketplace.  The authors concluded that reducing nitrogen application rates past the economic optimum would have unacceptable consequences for grain markets and food security, especially for continuous corn.  I looked at the same figure and concluded that growing corn after corn would not be commercially viable in a society that valued clean water, a stable climate, and public health. 

Your mileage may vary

My biggest takeaways from both the Iowa State University research and the Practical Farmers of Iowa research are how much the optimum nitrogen rate varies from year to year and place to place. One farmer in the PFI study saved money by reducing rates from 150 to 100 lbs/acre, while another lost money by reducing rates to 246 to 200 lbs/acre. 

 The ISU study includes nitrogen rate trials for seven sites in Iowa and six years since the Iowa Nutrient Reduction Strategy was released.  If you had followed the recommendations from the old nitrogen rate calculator and applied 140 lbs/acre to corn after soybeans, 62% of the trials would been at least 10 lbs/acre below the economic optimum.  But even in the most recent year, there were 2 sites where that would have been at least 10 lbs/acre above the economic optimum!

The Iowa Nitrogen Initiative addresses this problem through an expanded program of nitrogen rate trials and a decision support tool that can provide customized recommendations by county given assumptions about rainfall, planting date, and residual soil nitrate.  Using the new information, some farmers will find an opportunity to increase profits while reducing nitrogen rates.  A larger group of farmers will find opportunities to increase profits by increasing nitrogen rates. Dr. Castellano has made a complicated argument for how the water quality benefits of bringing down the high rates can be greater than the water quality penalties of bringing up the low rates.   Great.  Please apply that logic to manure.

What about manure?

Since 2017, the INREC survey report has asked farmers what percent of fields receive manure application (about 20%), how much commercial fertilizer is applied to fields that do not (174 lbs/acre for corn in rotation and 199 lbs/acre for continuous corn), and what proportion of cropland is planted to continuous corn (about 12%).  Manure expert Dan Anderson recently did some algebra to see what that implies about nitrogen application rates for fields that do receive manure, and came up with 342 lb N/acre on corn-after-soybean and 391 lb N/acre on continuous corn.  I used slightly different assumptions and came up with lower numbers, but they’re still much higher than needed to maximize yield.  If you’ve read anything by Chris Jones, this won’t come as a surprise.

I’m showing the agronomic optimum rate rather than economic optimum because the economics of manure aren’t the same as commercial fertilizer.  Manure has much lower nutrient content and is much more expensive to haul.  Manure pits fill up and there’s often a time and labor crunch to get it applied.  Manure has highly variable nutrient content, which adds to the uncertainty and makes a supplemental application of commercial fertilizer seem like cheap insurance.  If farmers had a strong economic incentive to make the most of manure nitrogen, nobody would be applying it in early fall and we wouldn’t have a cloud of ammonia hanging over the Midwest.  There are also some farmers who are doing an exceptional job of conserving soil and water by feeding cover crops, small grains, or forage to livestock, and we should figure out how to level the playing field to make it easier to replicate their model.

Are these changes in nitrogen management good or bad?

It’s a mixed bag.  I had to puzzle over this for quite a while!

The increase in the economic optimum nitrogen rate is partly due to good things (improved corn yield response) and partly due to bad things (increasing nitrogen losses to the air and water). 

It’s good that nitrogen fertilizer use has gotten more efficient.  Farmers can grow more bushels per pound of nitrogen than they used to.  It’s bad that manure management plans still allow nitrogen to be applied at a rate of 1.2 lbs per bushel of potential yield.

It’s good that fertilizer rates for corn following soybeans have levelled off recently.  It’s bad that nitrogen fertilizer rates went up in the early 2000s.

It’s good that nitrogen application rates for continuous corn have fallen.  It’s bad that farmers are planting corn after corn. 

It’s good that farmers are now applying less commercial fertilizer (on average) than required to maximize yield.  It’s bad that farmers are over-applying manure. 

It’s bad that we don’t have a plan to reach the goals of the Iowa Nutrient Reduction Strategy without rate reduction, and it’s bad that the price tag of reducing rates (either to farmers, the public, or both) is higher than we previously assumed.  However, it might still be a better deal than other conservation practices.  It’s bad than more people aren’t talking about this.

Progress Tracking: Why It’s Lacking

Progress Tracking: Why It’s Lacking

If the Iowa Nutrient Reduction Strategy had a United Way style progress banner

You know those United Way posters with a thermometer showing progress toward a fundraising goal?  The image above is my attempt at a similarly easy-to-understand progress meter for the Iowa Nutrient Reduction Strategy (INRS).  Based on changes to farming practices in the decade since the Iowa Nutrient Reduction Strategy was released, we should have met our goal for phosphorus but have only reduced nitrogen losses by 2%, not enough to undo the increases of the previous decade.  These are best-case scenarios which do not account for manure, legacy sediment and nutrients, and interactions between practices.

Iowa State University is responsible for tracking the progress of the INRS, and has created a set of data dashboards covering dollars spent, minds changed, conservation practices on the land, and water quality trends in the rivers.  These were updated in May of 2024.  There is no top-line summary of where we stand relative to our goals, but wasn’t hard to make one.  I just added up the numbers in a pair of tables labelled “change in modeled nitrogen/phosphorus load for practices since the baseline period.”

Change in modeled nutrient loads, from ISU dashboard

Baselines, Goals and Timelines

The timeline requires some explanation.  The INRS was released in 2013, but the baseline period is 1980-1996.  That’s because the Hypoxia Action Task Force was formed in 1997.  The task force set a goal of reducing the size of the dead zone in Gulf to 5000 square kilometers (1,930 square miles).  The target date for meeting that goal has been pushed back several times.  Despite several dry years, the five-year average extent of the dead zone is still twice as big as the target.  Last year it measured 6,705 square miles, larger than Connecticut or Hawaii.

To meet the goals for shrinking the dead zone, each state would need to reduce the amount of nitrogen and phosphorus lost down the Mississippi River by 45%.  The Iowa Department of Natural Resources determined that mandatory upgrades for 102 municipal wastewater treatment systems and 28 industrial facilities could reduce state’s overall nitrogen load by 4% and phosphorus load by 16%.  The remaining 41% reduction in nitrogen load and 29% reduction in phosphorus load would need to come from controlling non-point sources of pollution like agricultural runoff.

Iowa State University was tasked with answering the question: “based on what we know about the performance of various conservation practices, how would it be possible to achieve these goals?”  The answer was “only with a combination of practices, and only if every farm uses at least one of them.”  This research began in 2010, using data about land use and farming practices from the previous five years (2006-2010), so the load reduction scenarios are relative to that “benchmark” period.  The researchers later issued a supplemental report to compare the benchmark period to the baseline.  Phosphorus went down due to changes in tillage but nitrogen went up due to an increase in corn and soybean acres and an increase in fertilizer application rates.

Using the information in ISU’s reports and dashboards, I’ve attempted to summarize our progress relative to both the baseline period (before the formation of the Hypoxia Action Task Force) and the benchmark period (before work began on the Iowa Nutrient Reduction Strategy).

Table showing progress of INRS relative to two periods

Modeling vs. Monitoring

As I said, these are best-case scenarios.  While we can certainly expect a big reduction in phosphorus pollution from the growth of no-till and cover crops, ultimately, the only way to be sure that water quality is improving in our rivers is to test it!  If there’s a discrepancy between what you expect (a big reduction in phosphorus load) and what you measure (no clear trend in flow-weighted, five-year-moving-average phosphorus loads) that’s a sign that you left something important out of the spreadsheet!  The most likely suspects are legacy sediment in the river valleys and livestock manure.

On the other hand, if your water quality data is incomplete or inconclusive or just hard to explain, it’s worth stepping back and asking yourself: “how big a reduction in nitrogen can I reasonably expect, based on the conservation practices installed so far?”  If the answer is “1 or 2 percent,” there’s no need to wait for the results of a long-term study to acknowledge that your strategy isn’t working.

I remember doing that kind of reality check in 2019 for the Ioway Creek Watershed Management Authority, at the end of a four-year demonstration project.  I did not enjoy being the bearer of bad news then, and I’m not enjoying it now.  I remember how much work my colleagues put into those field days, and the ingenuity and vision displayed by the farmers who hosted them.  I was there when the woodchips were poured into the first bioreactor in Boone County.  So I totally understand the impulse to brag that Iowa now has 300 bioreactors, 3.8 million acres of cover crops, and 10.2 million acres of no-till.  Many people worked hard to achieve those numbers!  It is real progress!  It’s kept nutrients and sediment out the water!  It proves that there are many farmers who care about soil and water and are doing something about it!  But it doesn’t prove that the Iowa Nutrient Reduction Strategy is working.  For nitrogen, it definitely isn’t.

Conservation efforts have been partially offset by increased fertilizer use

I knew that we needed a lot more cover crops, wetlands, and saturated buffers to reach our nitrogen goal.  Iowa Environmental Council has made this point with infographics.  What I didn’t realize was the extent to which increases in fertilizer application rates have offset the hard-won gains that we’ve achieved so far. 

Nutrient rate management was supposed to be the low-hanging fruit the Iowa Nutrient Reduction Strategy.  At the time the INRS was written, the Maximum Return to Nitrogen (the point at which the yield bump from an additional pound of fertilizer doesn’t generate enough revenue to cover the costs) was 133 lbs/acre for corn in rotation and 190 lbs/acre for continuous corn.  Reducing rates from 150 lbs/acre for corn in rotation and 201 lbs/acre seemed like an easy way to reduce nitrogen in the rivers by 10% while actually saving farmers money.  Win-win!  Instead, rates for corn in rotation averaged 173 pounds/acre for the past several years, which would raise nitrate levels in tile water by 18%!  Rates for continuous corn went down just a tiny bit, to 199 lbs/acre.  What happened?

Effects of nitrogen fertilizer rates on water quality.  Corrected 2025-10-16.
Table from INREC survey

Several of the authors of the INRS science assessment just co-authored a new paper in Nature Communications which provides an answer.  133 lbs/acre was economically optimal under outdated assumptions about corn genetics and yield response, fertilizer and corn prices, and precipitation.  Factoring all that in, the optimal rate for corn in rotation actually rose to 187 pounds/acre in 2020, leaving no opportunity for a win-win.  Farmers are acting in their rational economic self-interest and applying as much nitrogen as is required to get good crop yields after a heavy spring rain.  (Huge caveat: this doesn’t factor in manure).  The researchers acknowledged that this is bad for water quality, as measured by a growing gap between the economically optimal rate and an “environmentally optimal rate” with some externalities priced in.  Another way to say that: the fraction of agribusiness profits which come at the expense of other industries (i.e. commercial fishing in the Gulf, tourism for communities on polluted lakes) and the public (i.e. utility bills for customers of the Des Moines Waterworks, hospital bills for cancer patients) has been growing. 

Figure adapted from Baum et al 2025

The companion piece to this paper is a new calculator.  N-FACT uses data from on-farm nitrogen rate trials to factor in location, planting date, residual soil nitrogen, fertilizer price, and your best guess about corn prices and rainfall to provide a customized economically optimal nitrogen rate.  The research that went into it is very impressive, and gave me a new appreciation all the factors that can influence agronomists’ recommendations and farmers’ decisions.  I hope it will lead to reduced nitrogen losses by helping farmers improve their forecasting, but unless you’re doing a split application and soil or corn stalk testing, it seems like there’s still a lot uncertainty.  That’s why I’m more excited about Practical Farmers of Iowa N Rate Protection Program, which directly addresses uncertainty and risk.

What we really need is a calculator to answer the following questions about the Iowa Nutrient Reduction Strategy:

  • How much voluntary conservation will it take to offset future profit-driven changes in the industry?
  • How soon can we expect to see meaningful reductions in nitrate in our rivers and drinking water?
  • How many people will get preventable cancers in the meantime?
  • How long is the public going to put up with this before we demand a change in strategy?

What do I mean by “a change in strategy?”  Making policy recommendations isn’t our wheelhouse, but if you’re looking for ideas, you might start with this 2020 op-ed by Matt Liebman, Silvia Secchi, Chris Jones, and Neil Hamilton, or this 2022 report by the Iowa Environmental Council.

The Best Nitrogen Analogy Ever

The Best Nitrogen Analogy Ever

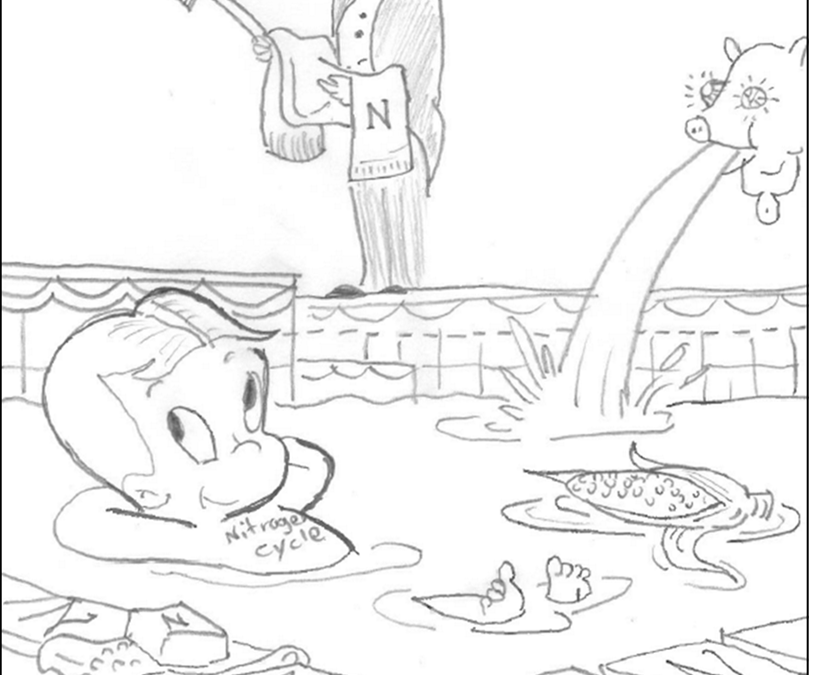
Imagine the nitrogen cycle is a trust fund kid with a gambling problem.

 The young man (a corn field) is very rich (has rich black soil) but the money (nitrogen) he inherited from his father (the prairie) is locked in a trust fund (soil organic matter). Only a small portion of the funds are released to him each year (mineralized) following a complicated schedule determined by the trustees (microbes in the soil). In order to maintain the lifestyle to which he has become accustomed (provide enough nitrogen to the crop for good yields), he needs supplemental income (nitrogen from commercial fertilizer or manure). His sister (a soybean field) does not need to work (apply fertilizer) because she can borrow money from her well-connected husband (symbiotic nitrogen-fixing bacteria) but she also receives payments from the trust (mineralization).  She helps her brother out (corn needs less nitrogen fertilizer following soybeans) but not directly (soybeans actually use more nitrogen than they fix, so the benefits of the rotation has more to do with the behavior of the residue and disrupting corn pests).

A Richie Rich cartoon, but with nitrogen

Both siblings have a gambling (water quality) problem and are terrible poker players. Whenever they’re feeling flush with cash (when other forms of nitrogen have been converted to nitrate) they blow some of it playing cards (nitrate easily leaches out of the root zone when it rains), but the extent of the losses vary and debts aren’t always collected right away (nitrate leached out of the root zone may not immediately reach streams). They struggle with temptation more than their cousins (alfalfa and small grains) because they come from a broken home (the soil is fallow for large parts of the year) and because bills and income don’t arrive at the same time (there is a mismatch between the timing of maximum nitrogen and water availability and crop nitrogen and water use).

“”Okay, Dan, that’s very clever, but what’s your point?

Well, having compared the soil to a trust fund, I can now say “don’t confuse net worth with income.” You’ve probably heard that there 10,000 pounds per acre of nitrogen stored in a rich Iowa soil. That’s true but misleading. The amount actually released each year by decomposing organic matter (net mineralization) is only a few percent of that, comparable in size and importance to fertilizer or manure.  Here’s an example nitrogen budget.

Example nitrogen budget, for Tipton Creek in Hamilton & Hardin Counties

On average and over the long-term, we know that fields and watersheds with higher nitrogen applications (taking into account both manure and commercial fertilizer) leach more nitrate into the water. On average and over the long-term, we know that that farmers can profit by reducing their application rate to the Maximum Return To Nitrogen (the point at which another pound of nitrogen does not produce a big enough yield bump to offset the fertilizer costs).  Right now, with corn prices high but fertilizer prices going nuts, the MRTN is 136 pounds per acre for corn following soybeans, while in the most recent survey I could find, farmers reported applying an average of 172 pounds per acre.  So there’s room to save money while improving water quality!

But having compared nitrate leaching to gambling, I can also say “don’t confuse a balance sheet problem with a cash flow problem.”  In any given year, it’s always a gamble how much of the nitrogen that’s applied will be washed away and how much will be available to the crop.  Maybe some farmers are passing up on an opportunity to increase their profits because they’re not comfortable with the short-term risks.

Figure from John Sawyer
current MRTN

 Farmers say that extra nitrogen is cheap insurance.  If that’s true, maybe we need crop insurance that makes it easier to do the right thing, not a more precise calculator.

It’s Rude to Point, but…

It’s Rude to Point, but…

By my calculations, over 65% percent of the nitrogen load in Ioway Creek on May 20 came from less than 1 percent of the land area in the watershed.  We still don’t know why.

Revised May 31

Many people assume that fertilizer applied to turf grass is a major source of nitrogen and phosphorus pollution in Iowa.  At a presentation to the Ames City Council, I was asked if a public awareness campaign aimed at lawn care professionals and homeowners would be an effective way to improve water quality in Ioway Creek.  If we’re talking nitrogen, I don’t think so:

  1. Because turfgrass covers a tiny proportion of the land in most Iowa watersheds, compared to cropland.
  2. Because turfgrass is a perennial. Having something growing and taking up available nutrients year-round is the principle on which cover crops reduce nitrogen loss.
  3. Because there was a study by Dr. Keith Schilling that found very low nutrient levels in shallow groundwater below six Iowa golf courses.
Turf grass in the rain

To that list, I can add local water quality monitoring including lab testing and sensor results from May.  Nitrate in Ioway Creek and the South Skunk River were the highest we’ve seen for a few years, but while rural tributaries ranged from 12-20 mg/L of nitrate, College Creek (an urban watershed with plenty of turf grass) measured only 2.3 mg/L.

But even if turf grass in general isn’t a serious water quality problem, maybe some specific areas of turf grass are a problem.  That’s what I thought after reviewing the data from our spring water quality snapshot on May 17.  Volunteers found a big difference in nitrate levels between South Duff Ave and other sites in Ames.  I wondered if it could be a mistake, so I went back out on May 20 with a bottle of test strips and a smartphone app that enables more precise measurements.  It wasn’t a mistake (nitrate in Ioway Creek increased from 8.6 mg/L to 24 mg/L in two miles), but the results still weren’t making sense, so I kept testing and testing until I assembled the map below.  By my calculations, 65% of the nitrate load in Ioway Creek that day was coming from just 1,500 acres!

map showing nitrate results on May 20

The 1,500 acres includes Coldwater Golf Links, and the pattern looks like what I’d expect to see if the golf course was overapplying fertilizer.  However, the golf course superintendent has informed me that fertilizer has not been applied since fall, and then only at a low rate.  A volunteer tested two ponds on the course and found low levels of nitrate (1-2 mg/L).

The 1,500 acres include some developed areas north of creek drained by storm sewers, but I tested water trickling from two outfalls on May 20 and found very low nitrate levels: 0.5 mg/L and 3.1 mg/L.

Worrell Creek at golf course

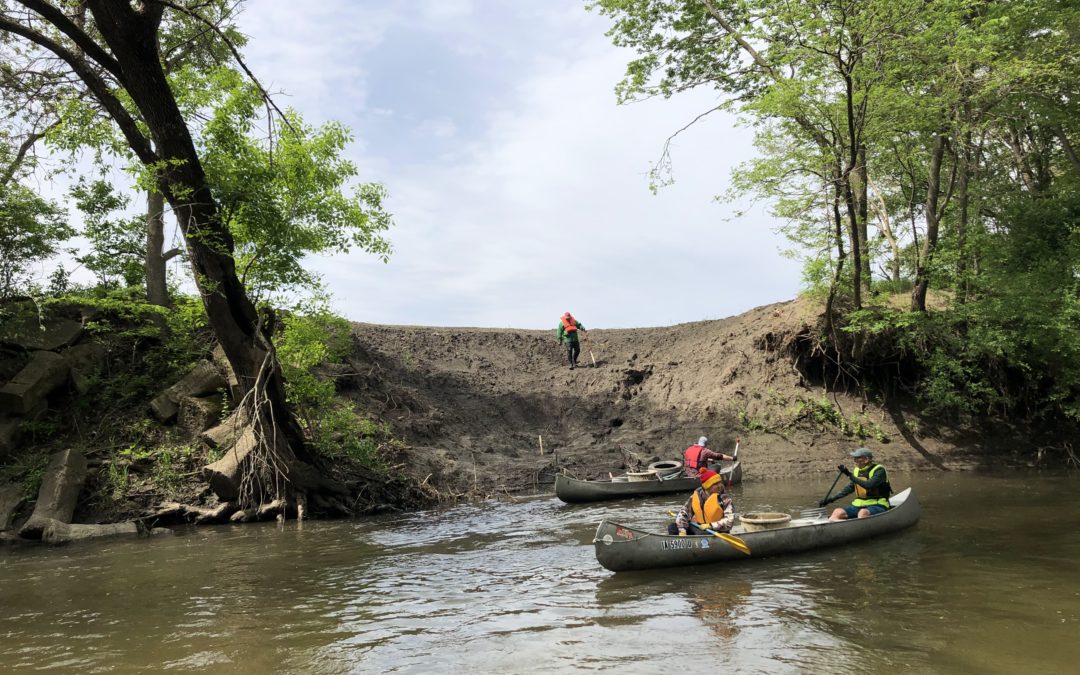
The 1,500 acres acres also includes two construction sites: a flood mitigation project near South Duff Ave and an ISU recreation complex east of Jack Trice Stadium.  The photo shows severe bank erosion where drainage from the ISU construction site enters the creek.  An inspector with the Iowa DNR noted problems with erosion control earlier this spring on the South Duff project.  However, if the nitrate spike were linked to erosion, I’d expect to see high phosphorus and low transparency.

Honestly, I’m not sure what’s going on here.  It’s not a pattern we’ve seen in previous years.

erosion on Ioway Creek between Grand and Duff avenues

When interpreting this kind of data, there is a risk of jumping to conclusions and unfairly pointing fingers.  In my first draft of this article, I suggested that Coldwater Golf Course was the source of the nitrate and the bank erosion.  That was premature.

However, there is also a risk that we will waste time and money on the wrong solutions or the wrong areas if we don’t test water or don’t follow where the data is pointing.  It’s clear from this month’s data and many other rounds of testing that water quality impacts are not uniformly distributed across the landscape.

Weather whiplash

Weather whiplash

cover crops near Nevada
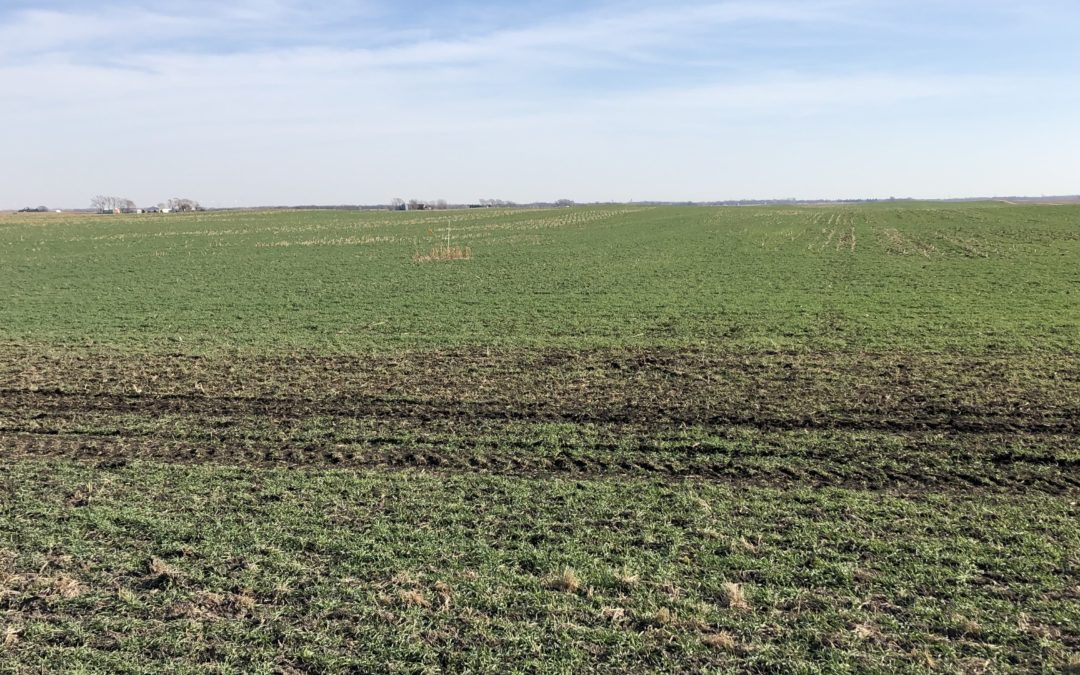
Nice looking rye cover crop near Nevada, IA
November 2020

A big thank you to farmers who planted cover crops after this challenging year. Cover crops will hold soil and nutrients in place through the winter and early spring. That could be especially important this year.

After a drought, nitrogen that might normally have been taken up by a high-yielding crop or flushed away by rainfall remains in the soil. That leftover nitrogen could be available for next year’s crop, but only if:

A) we have a dry spring, or

B) farmers have made use of practices like cover crops or nitrification inhibitors that prevent nitrogen losses during the fallow season.

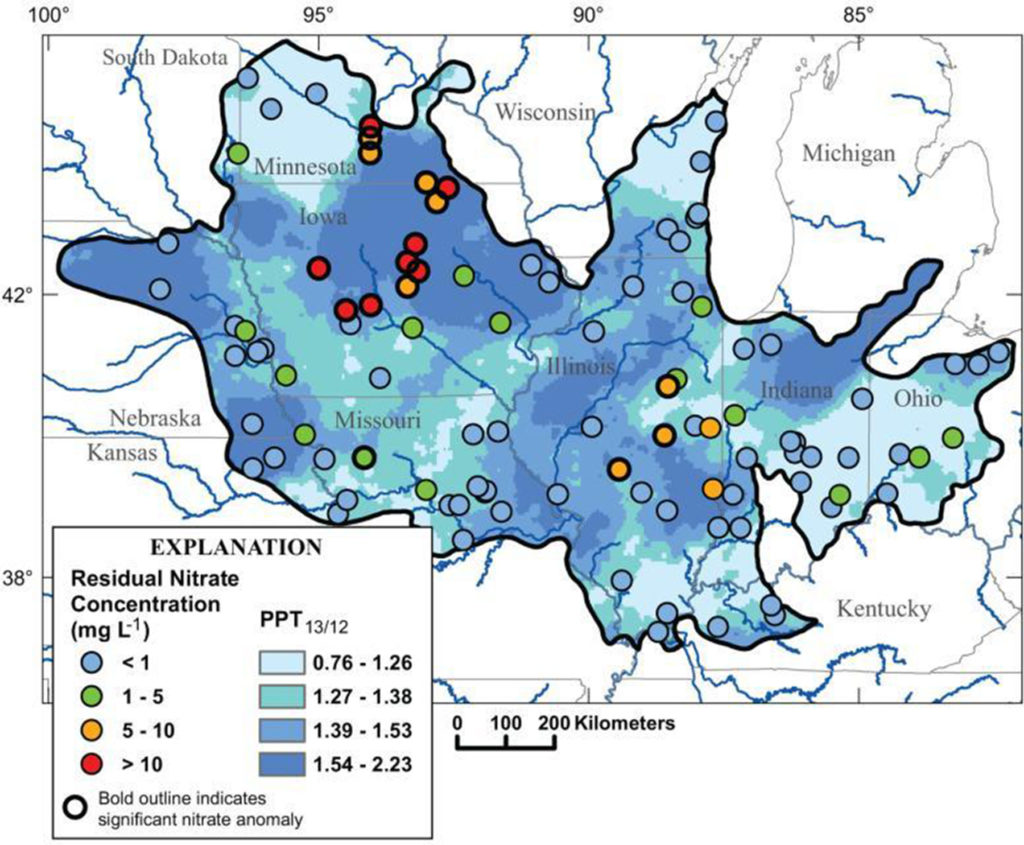
A wet year in 2013 following a dry year in 2012 (dark blue) caused nitrate concentrations in many central iowa streams to jump as much as 10 mg/L higher than usual (red). Figure from Van Metre et al. 2008

A drought in 2012 following by a wet spring in 2013 led to nitrate concentrations in excess of 20 mg/L in many rivers in Central Iowa. If we have a wet spring in 2021, we could see this happen again. As one scientific paper put it, “weather whiplash drives deterioration of water quality.”

“Weather whiplash” can also help explain the long-term trends I’ve been seeing in the South Skunk River and its tributaries: a decline in nitrate concentrations from 2005-2012, a big jump in 2013, and another decline over the past 7 years. I’ll walk you through my analysis.

Explaining nitrate concentrations in the South Skunk River

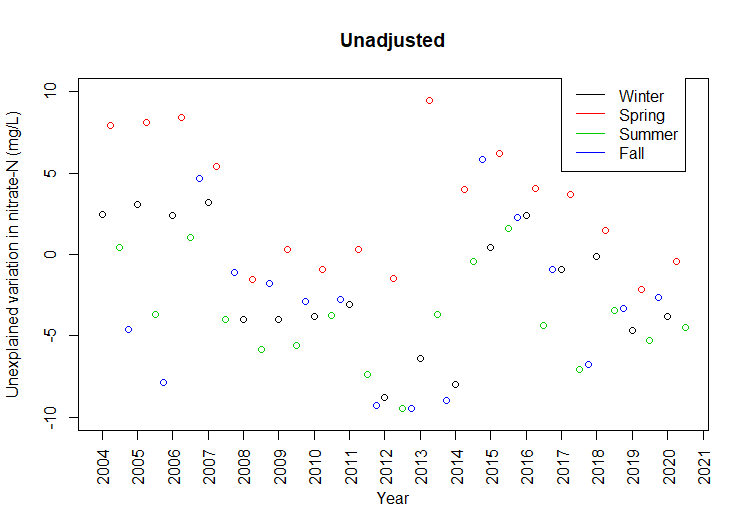
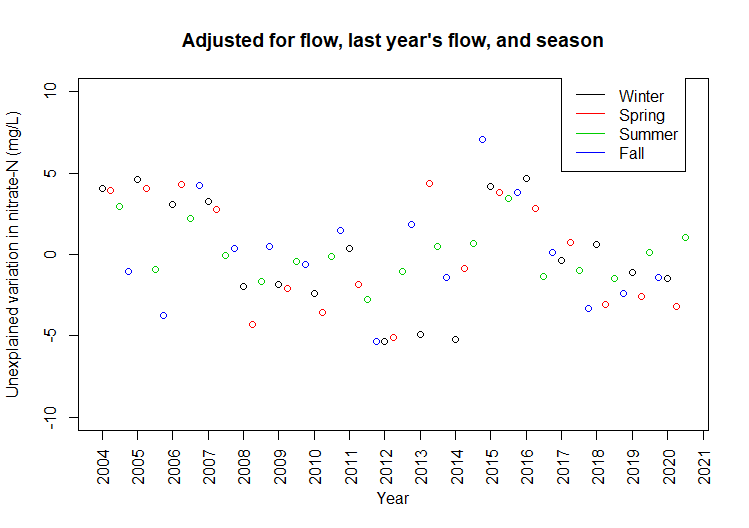
Technical details, feel free to skip: This data was collected by the City of Ames just upstream of wastewater treatment plant. The City has monitored the South Skunk River above and below its wastewater treatment plant almost every week since 2003! Flow is measured continuously at a few miles upstream USGS gage near S. 16th St. I’ve summarized nitrate concentrations and streamflow by season (Jan-Mar, Apr-Jun, Jul-Sep, Oct-Dec). At each step of the way, I apply a linear regression equation and graph the model residuals. Taken together, these three factors explain 59% of the variation. The effects of “weather whiplash” may extend beyond one year, since nitrate from some parts of the field may travel more slowly to streams via groundwater.

In a given quarter, nitrate concentrations in the South Skunk can be up to 10 mg/L higher than the long-term average, or as much as 10 mg/L lower. The following graphs show how much variation is left to explain after correcting for current weather, last year’s weather, and season.

Nitrate in the South Skunk is again declining after a sudden increase in 2013.
Low-flow conditions in 2011-2013 explain unusually low nitrate concentrations.
Wet springs following dry years explain unusually high nitrate concentrations.
Seasonal patterns explain some of the remaining variation.
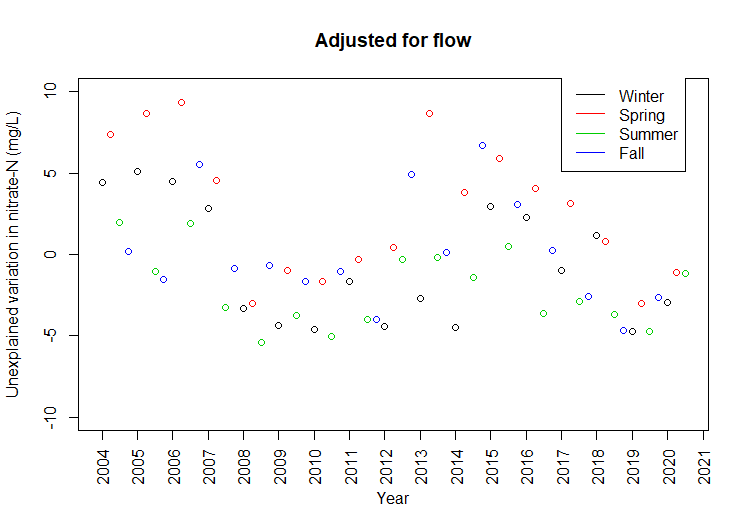
  1. The lowest nitrate concentrations can be explained by streamflow: when the weather is dry and tiles aren’t flowing, nitrate levels in rivers taper off to the background levels seen in groundwater.
  2. The highest nitrate concentrations can be explained by weather over the previous 12 months: a wet period following a dry period will flush out nitrate that’s accumulated in the soil.
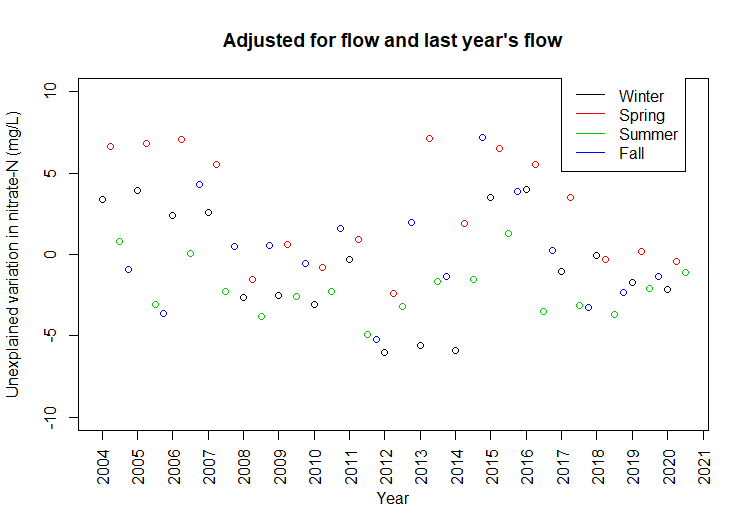
  3. After that, there’s still a seasonal pattern independent of rainfall: nitrogen is most susceptible to loss in spring when soils are bare and microbial activity picks up (April-June) and least susceptible when the maturing crop is using up the available nitrogen (July-Sept).
  4. Can some of the remaining pattern be explained by greater adoption of conservation practices in the watershed in the past 5 years? We hope so, but let’s see what happens next spring!