Can Infrastructure Spending Help Iowa’s Polluted Rivers?
“But look, you found the notice didn’t you?”
“Yes,” said Arthur, “yes I did. It was on display in the bottom of a locked filing cabinet stuck in a disused lavatory with a sign on the door saying Beware of the Leopard.”
– Douglas Adams, The Hitchhiker’s Guide to the Galaxy
I was reminded of this scene after spending a long day cross-referencing the Raccoon River TMDL (a pollution budget for nitrate and E. coli) with permits and monitoring data for wastewater treatment plants. In this case, I suspected that polluters were getting away with something, but I’ve had just as much trouble finding information when I wanted to document a success story.
Effluent limits for nitrogen are not strict. Wastewater treatment plants and meatpacking plants in the Raccoon River watershed routinely discharge treated wastewater with nitrate 4-6x the drinking water standard. Why is this allowed? The 2008 Raccoon River TMDL capped pollution from point sources at the existing level, rather than calling for reductions. Due to limited data, the wasteload allocations were an over-estimate, assuming maximum flow and no removal during treatment.
That’s all above board, but someone else at the DNR went a step further. Wasteload allocations in the TMDL were further inflated by a factor of two or three to arrive at effluent limits in the permits, using a procedure justified in an obscure interdepartmental memo. The limits are expressed as total Kjeldahl nitrogen, even though the authors of the TMDL made it clear that other forms of nitrogen are readily converted to nitrate during treatment and in the river. In short, the limits in the permit allow more nitrogen to be discharged than normally comes in with the raw sewage!
For example:
- The Storm Lake sewage treatment plant has an effluent limit of 2,052 lbs/day total Kjeldahl nitrogen (30-day avg). Total Kjeldahl nitrogen in the raw sewage is around 1000 lbs/day.
- The Tyson meatpacking plant in Storm Lake has an effluent limit of 6,194 lbs/day total Kjeldahl nitrogen (30-day avg). Total Kjeldahl nitrogen in the raw influent is around 4,000 lbs/day.
- I also checked a permit affected by the (now withdrawn) Cedar River TMDL. Same story. The Cedar Falls sewage treatment plant has an effluent limit of 1,303 lbs/day total nitrogen (30-day avg). Average total nitrogen in the raw sewage is between 1000-1500 lbs/day.
- Confused about the units? That may be deliberate. Total Kjeldahl nitrogen includes ammonia and nitrogen in organic matter. Nitrogen in raw sewage is mostly in these forms, which need to converted to nitrate or removed with the sludge in order to meet other limits and avoid killing fish. Nitrogen in treated effluent is mostly in the form of nitrate. At the Tyson plant, the effluent leaving the plant has around 78 mg/L nitrate, versus 4 mg/L TKN, but figuring that out required several calculations. At smaller plants, the data to calculate nitrate pollution isn’t even collected.
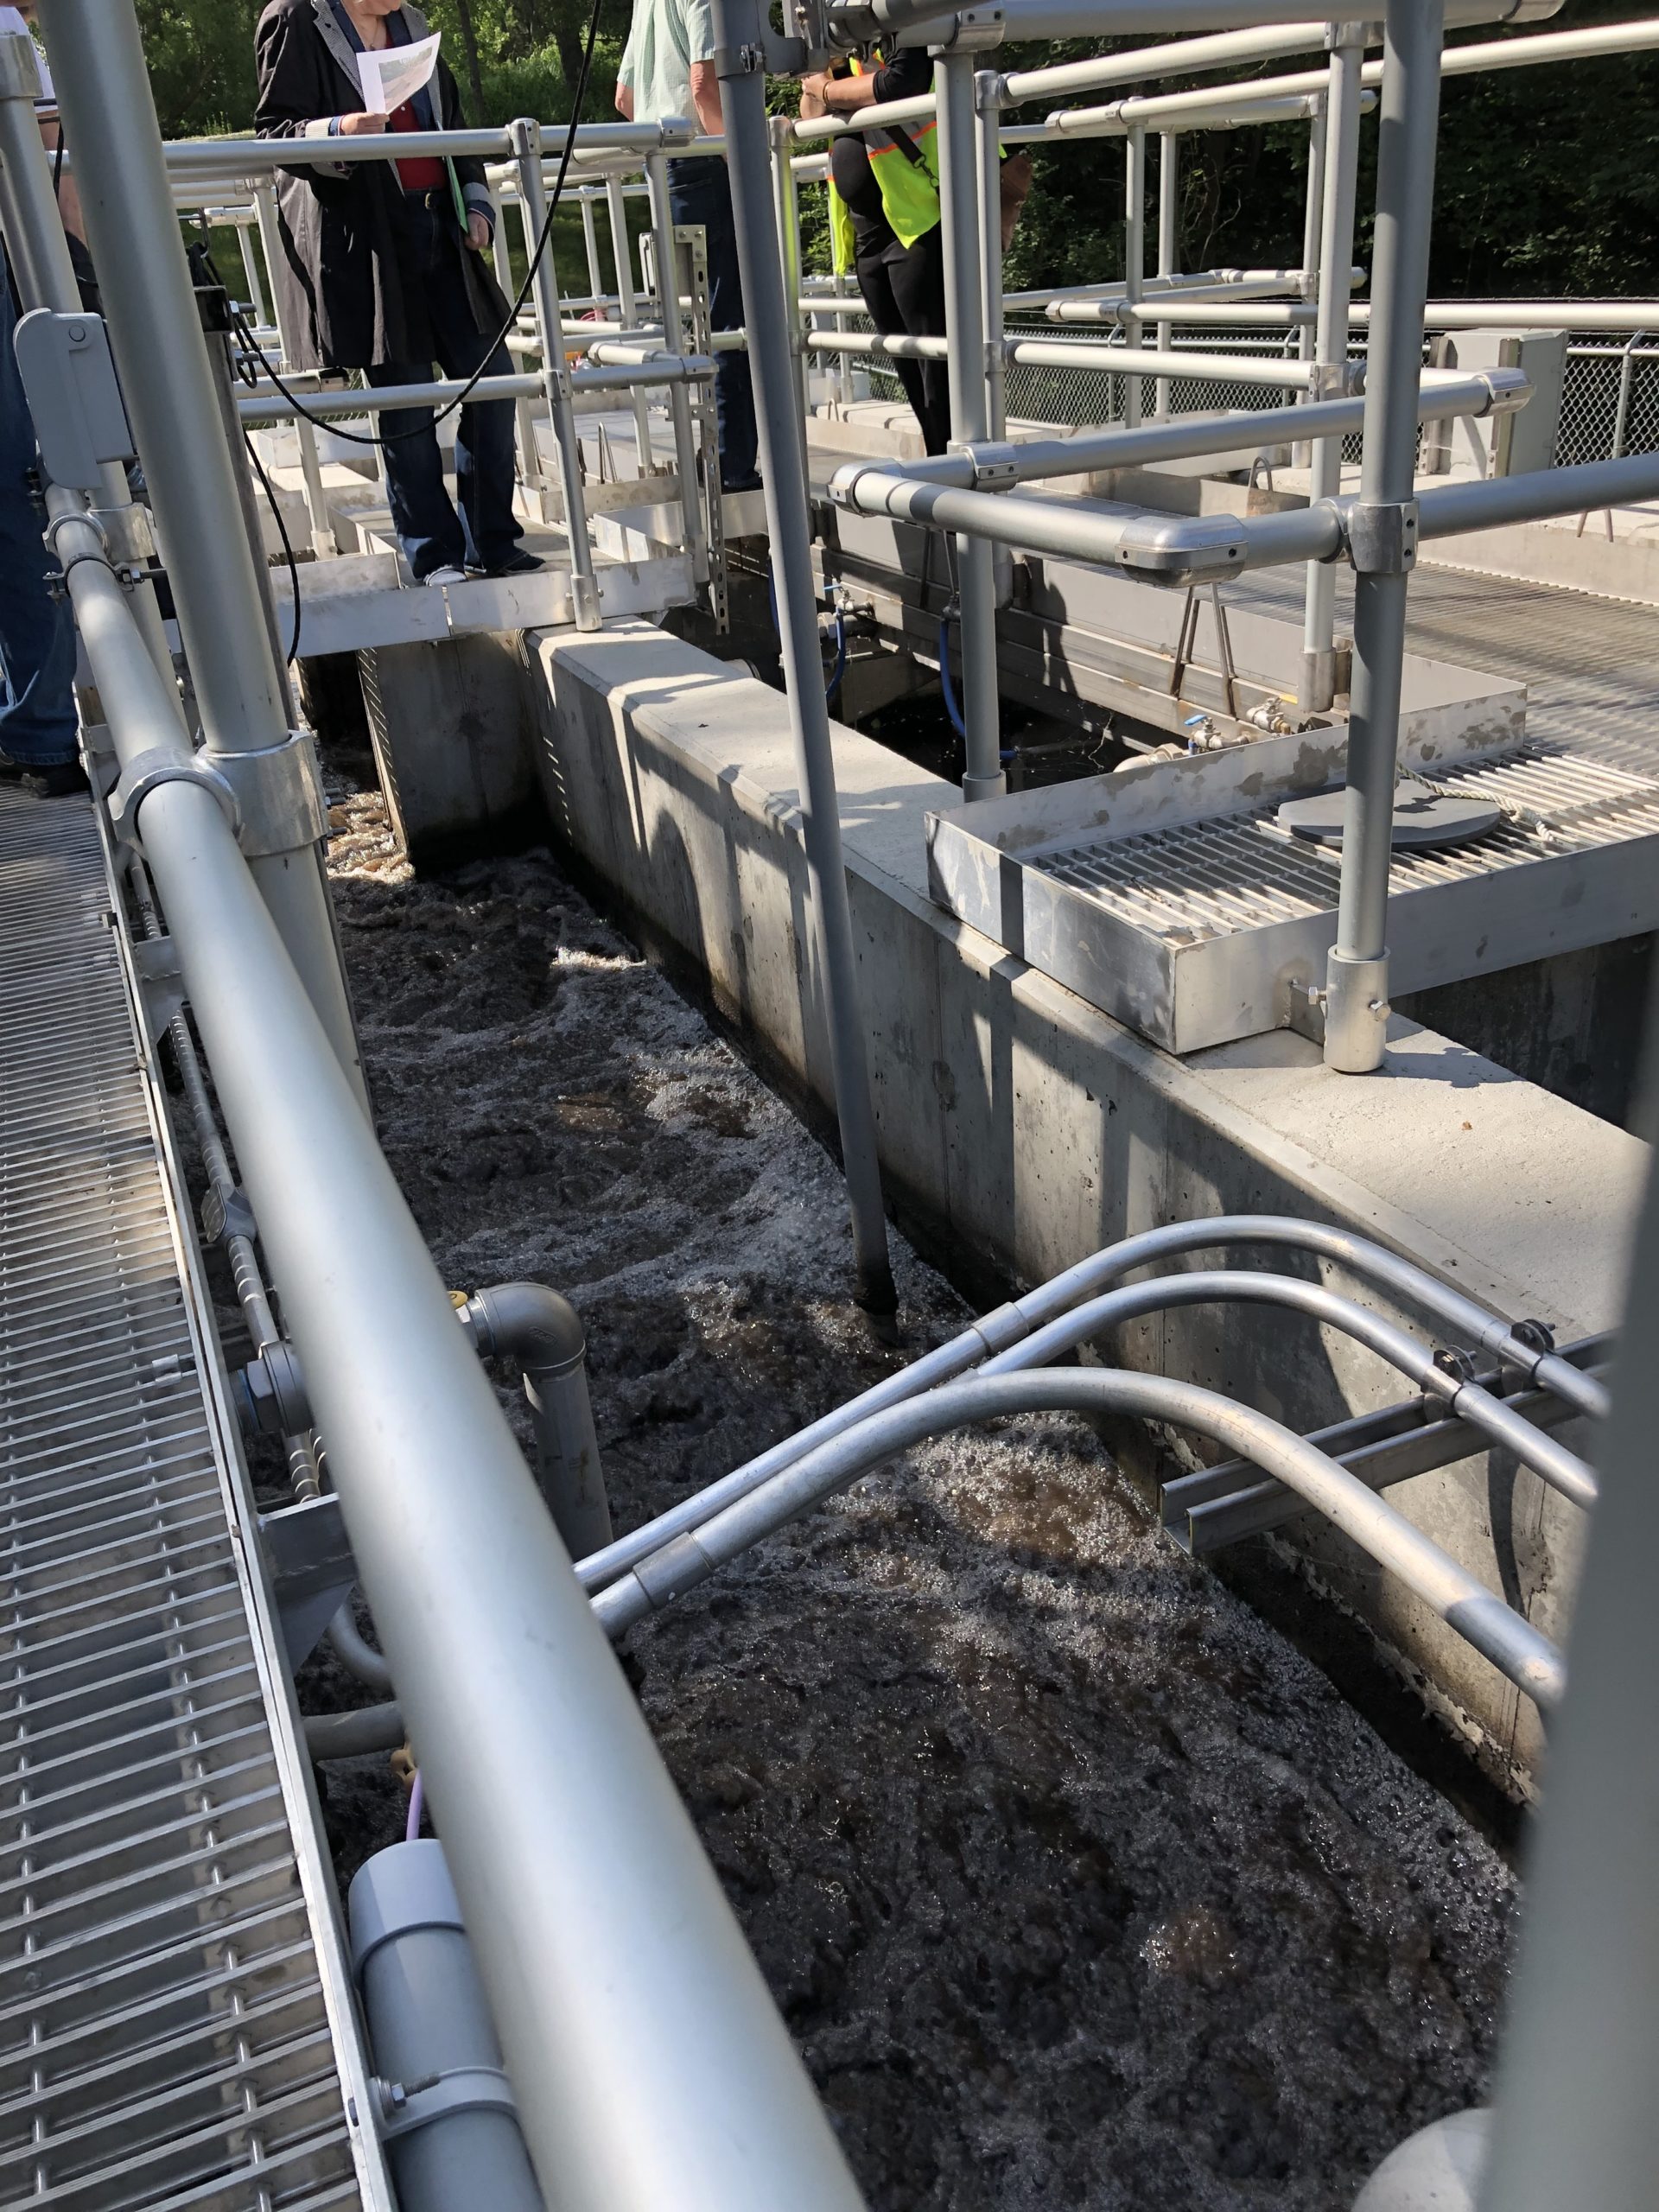
As part of the Iowa Nutrient Reduction Strategy, large point source polluters are supposed to evaluate the feasibility of reducing nitrate to 10 mg/L, and phosphorus to 1 mg/L. Tyson did a feasibility study for phosphorus removal, and is now adding new treatment to its Storm Lake plant. However, it is not required to evaluate or implement further nitrogen reduction, “because it is already subject to a technology-based limit from the ELG.” This federal Effluent Limitation Guideline was challenged in court by environmental groups this year, and is now being revised by the EPA. It allows meatpacking plants to discharge a daily maximum of 194 mg/L total nitrogen!
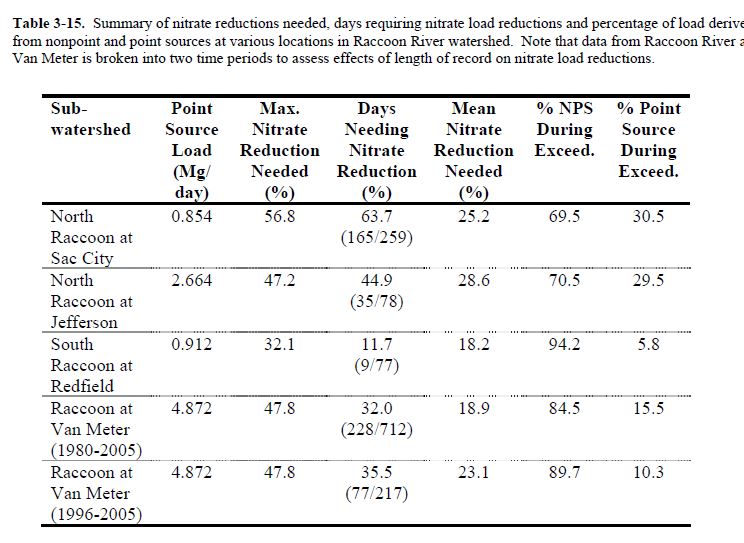
Fortunately, all this creative permitting has little impact on the cost and safety of drinking water in the Des Moines metro. According to research in the TMDL, point sources only account for about 10% of the nitrogen load, on days when nitrate in the Raccoon River exceeds the drinking water standard. However, the figure is much higher (30%) for the North Raccoon River. I started looking at permits and effluent monitoring because I was trying to explain some unusual data from nitrate sensors, brought to my attention by friends with the Raccoon River Watershed Association. During a fall with very little rain (less than 0.04 inches in November at Storm Lake), nitrate in the North Raccoon River near Sac City remained very high (8 to 11 mg/L). The two largest point sources upstream of that site can easily account for half the nitrogen load during that period.
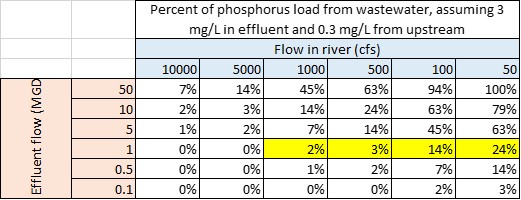
I was glad to be able to solve a mystery, and hope that this investigation can lead to some tools and teaching materials to help others identify when and where point sources could be influencing rivers. The load-duration curves in the 200-page Raccoon River TMDL are very good, but some people might benefit from something simpler, like this table. In general, the bigger the facility, the smaller the river, and the drier the weather, the more point sources of pollution can influence water quality, and the more wastewater treatment projects can make a difference.
In this work, I’m supported by partners around the state and a grant from the Water Foundation. The project (Movement Infrastructure for Clean Water in Iowa) focuses on building connections and shared tools around water monitoring, and will continue through this spring and summer. The funders’ interest is in helping the environmental movement make the most of the “once-in-generation opportunity” presented by the Inflation Reduction Act and the Bipartisan Infrastructure Law. This fiscal year, the Bipartisan Infrastructure Law is adding $28 million to Iowa’s Clean Water State Revolving Fund, which provides low-interest loans to communities to replace aging sewer systems and treatment plants. Can that infrastructure spending help Iowa’s polluted rivers? We won’t know for sure without better use of water quality data, and greater transparency in state government.

