Testing multiple sites within a short time period can provide a “snapshot” of water quality across a watershed, county, or state.
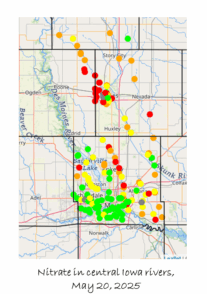
Polk County Conservation had great turnout for their spring water quality snapshot on May 20, testing 117 sites! I scheduled our event for the same day and volunteers help me test another 45 sites in Story, Boone and Hamilton counties. We also did some follow-up testing on May 21 for quality control and collected water samples for the lab. I have assembled the results from both events into a colorful interactive map that shows where water quality was good, fair, or poor in central Iowa during those two days.
There were a lot of “poor” readings on May 20. Not only was nitrate in the Skunk River and Raccoon River higher than we’ve seen in a decade, the water in most creeks was chocolate brown with sediment and had E. coli counts in the thousands.
One reason we do snapshot events is to get a better sense for where that pollution is (and isn’t) coming from. You’ll notice that streams with urban watersheds like Yeader Creek in Des Moines and College Creek in Ames have much lower nitrate than streams in rural areas. However, urban streams had high levels of sediment and fecal bacteria.
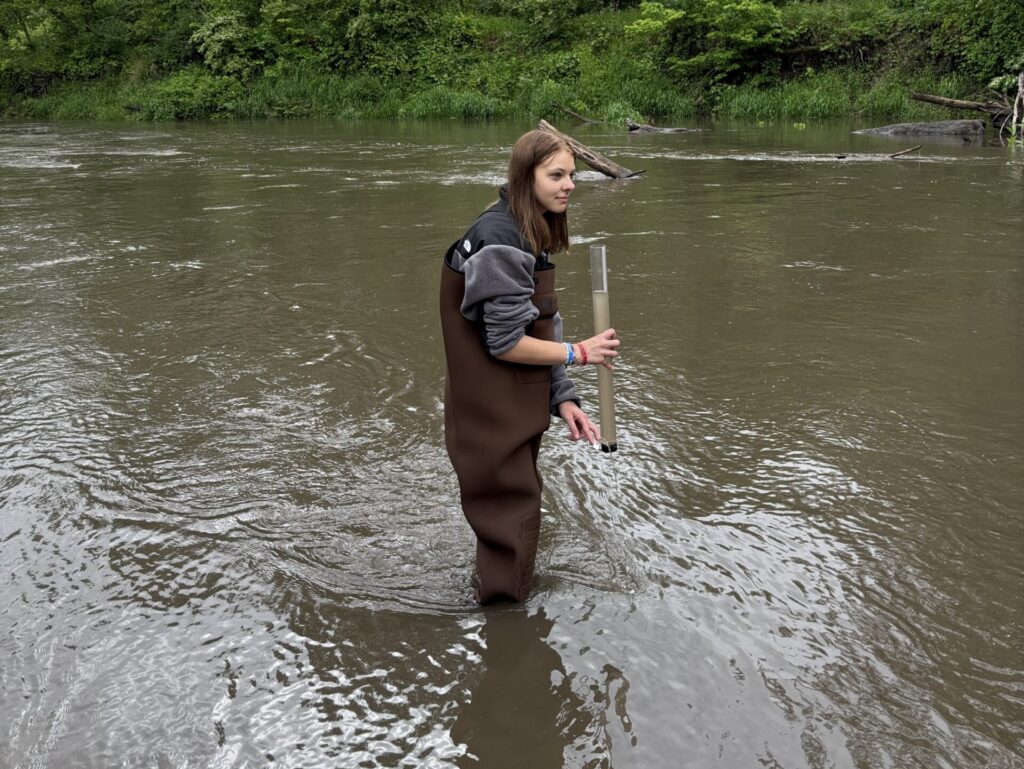
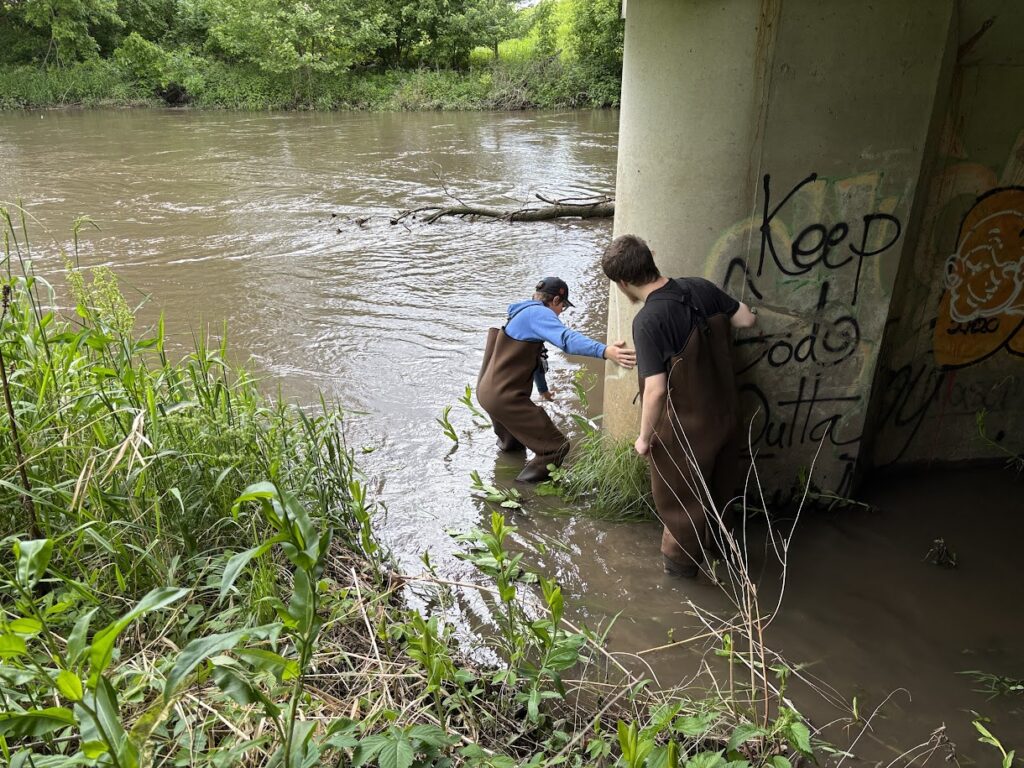
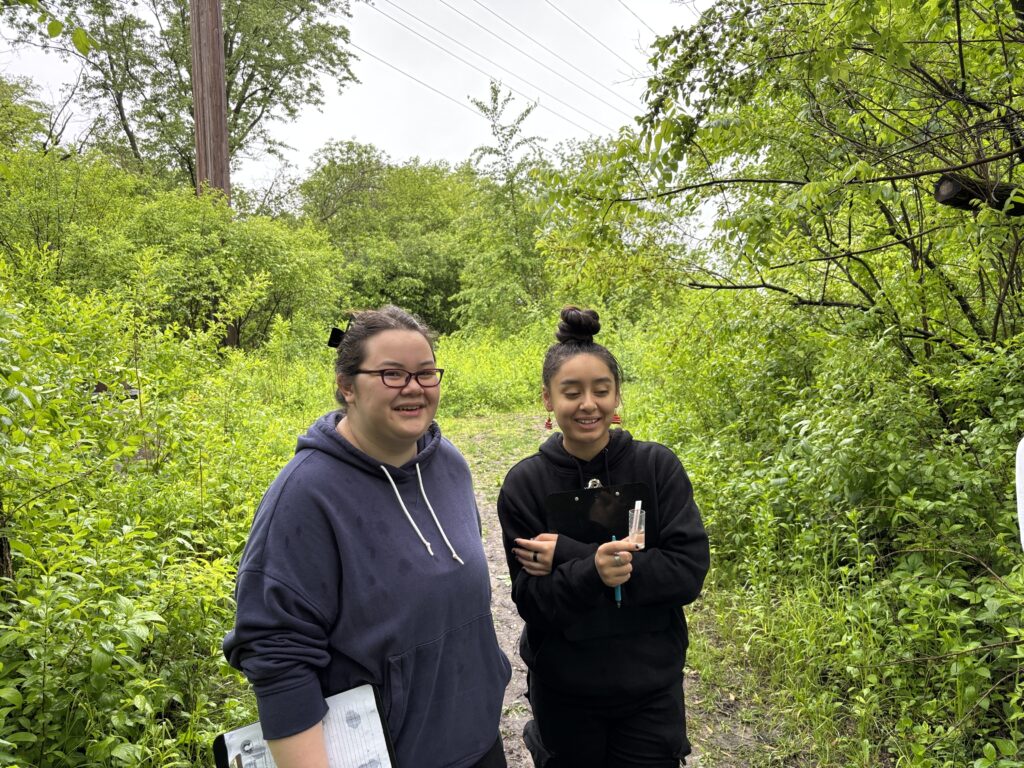
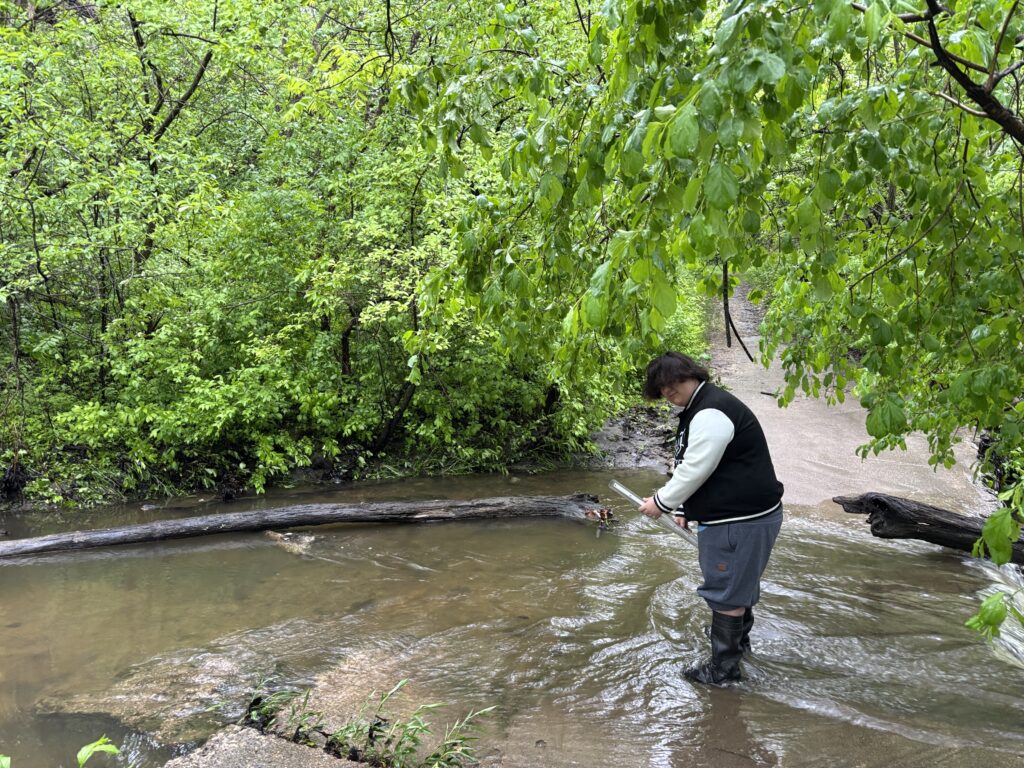
The other reason we do snapshot events is to provide a hands-on educational experience for people who might be curious about water quality but who can’t commit to monitoring a stream twice a month. I joined six classes of earth science students (taught by Kean Roberts and Collin Reichert) to test sites within walking distance of Ames High School. While there were a few complaints about the weather and walking in heavy waders, most students enjoyed the break from the classroom and spotting wildlife. The data students collected is part of a larger citizen science effort.
Volunteers in the Ioway Creek watershed have been doing twice-a-year snapshot events since 2006. Prairie Rivers of Iowa helped keep the tradition going after the IOWATER database was shut down in 2017, and we are in the process of uploading the data from those events to a permanent home on the Izaak Walton League’s Clean Water Hub!
However, I’ve wondered whether we should keep doing these events the same way now that Story County Conservation staff and volunteers are testing many of these streams on a regular basis. This is the third map I’ve made from a coordinated snapshot event (see also May 2024 and September 2023) and I’ve noticed some issues with our standard suite of tests that limit our ability to narrow down where pollution is coming from or where conservation practices are making a difference:
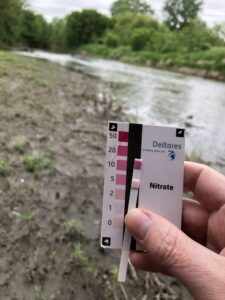
- Nitrate test strips are not very precise at the high range (color matches at 10, 20, or 50 mg/L). This can be improved with a smartphone app. We also had some big discrepancies that we traced back to a bottle of just-expired strips that I had assumed would still be okay; when in doubt, throw them out!
- Dissolved oxygen in streams has a daily cycle (rising in the afternoon when plants and algae are photosynthesizing), so sampling at the same time of day is more important than sampling on the same day.
- During scattered showers, water clarity may not tell us where the soil is better protected from erosion, just where the rain was more or less intense.
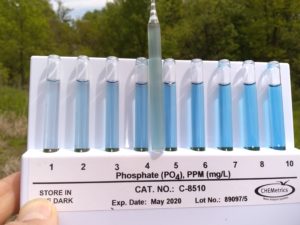
- It’s difficult to match colors to get a phosphate reading when the water is cloudy with sediment. I’ve tried filters but they clog with silt before you can get a 25 mL water sample.
Our next volunteer monitoring event might look a little different. I’d welcome ideas for how we can collect more useful data or get more new people involved!

Well-written review of discouraging data.